Measurements of accuracy and precision of the Loco Positioning system
To indicate the accuracy and precision of the Loco Positioning system, we have made a few measurements on our reference system. The measurements were performed on a static Crazyflie® using the log system of the client. We put the Crazyflie in a few known positions and logged the estimated position in the Crazyflie for further analyses. For each position 2000@100Hz samples were collected and the average and standard deviation were calculated for x, y, and z.
The errors when we measured the physical positions of anchors and the Crazyflie is probably in the +/- 5 cm range.
These measurements are in no way meant to be a specification of the system properties of the Loco Positioning system, but are intended to give an indication of the performance.
Multiple measurements in reference system
The reference system
The reference system is based on the indoor explorer bundle: one Crazyflie with a Loco Positioning deck and six Loco Positioning Anchors. See the [[doc:lps:index#reference_set-up|description of the reference system]] for details on the setup. All measurements were done in the Two way ranging mode.
The results
| Physical position | Average estimated position | Std-dev of estimated position | |||||||||
|---|---|---|---|---|---|---|---|---|---|---|---|
| X | Y | Z | X | Err | Y | Err | Z | Err | X | Y | Z |
| 1.62 | 3.15 | -0.15 | 1.66 | 0.04 | 3.18 | 0.03 | 0.29 | 0.44 | 0.014 | 0.0097 | 0.0061 |
| 2.95 | 0.00 | -0.15 | 2.80 | -0.15 | 0.12 | 0.12 | 0.16 | 0.31 | 0.0072 | 0.010 | 0.0053 |
| 1.62 | 3.15 | 1.44 | 1.56 | 0.06 | 3.02 | -0.13 | 1.37 | -0.07 | 0.020 | 0.0066 | 0.016 |
| 1.62 | 4.80 | 1.44 | 1.67 | 0.03 | 4.64 | -0.16 | 1.40 | -0.27 | 0.013 | 0.0093 | 0.013 |
Measurement of accuracy and noise of 3D estimate and ranges
Setup
The system is setup with 6 anchors and one Crazyflie ranging in two-way-ranging mode. The Crazyflie in static position without movement.
Positions
| Anchor | X | Y | Z |
|---|---|---|---|
| 0 | 3.01 | 0.57 | 2.5 |
| 1 | 3.01 | 2.63 | 2.5 |
| 2 | 6.53 | 2.27 | 2.84 |
| 3 | 6.53 | 0.51 | 2.84 |
| 4 | 2.91 | 0.86 | 0.16 |
| 5 | 6.95 | 2.32 | 0.16 |
Crazyflie: (x,y,z) = (5.00, 1.50, 0.76)
Measurements
- Kalman filter 3D estimated position
- Raw range measurement (not taken at the same time as the kalman estimate)
Analysis
Estimated position
| Physical position | Average estimated position | Std-dev of estimated position | Average error | |||||||||
|---|---|---|---|---|---|---|---|---|---|---|---|---|
| X | Y | Z | X | Err | Y | Err | Z | Err | X | Y | Z | distance |
| 5.00 | 1.50 | 0.76 | 4.96 | 0.017 | 1.60 | 0.041 | -0.096 | -0.213 | 0.017 | 0.018 | 0.015 | 0.237 |
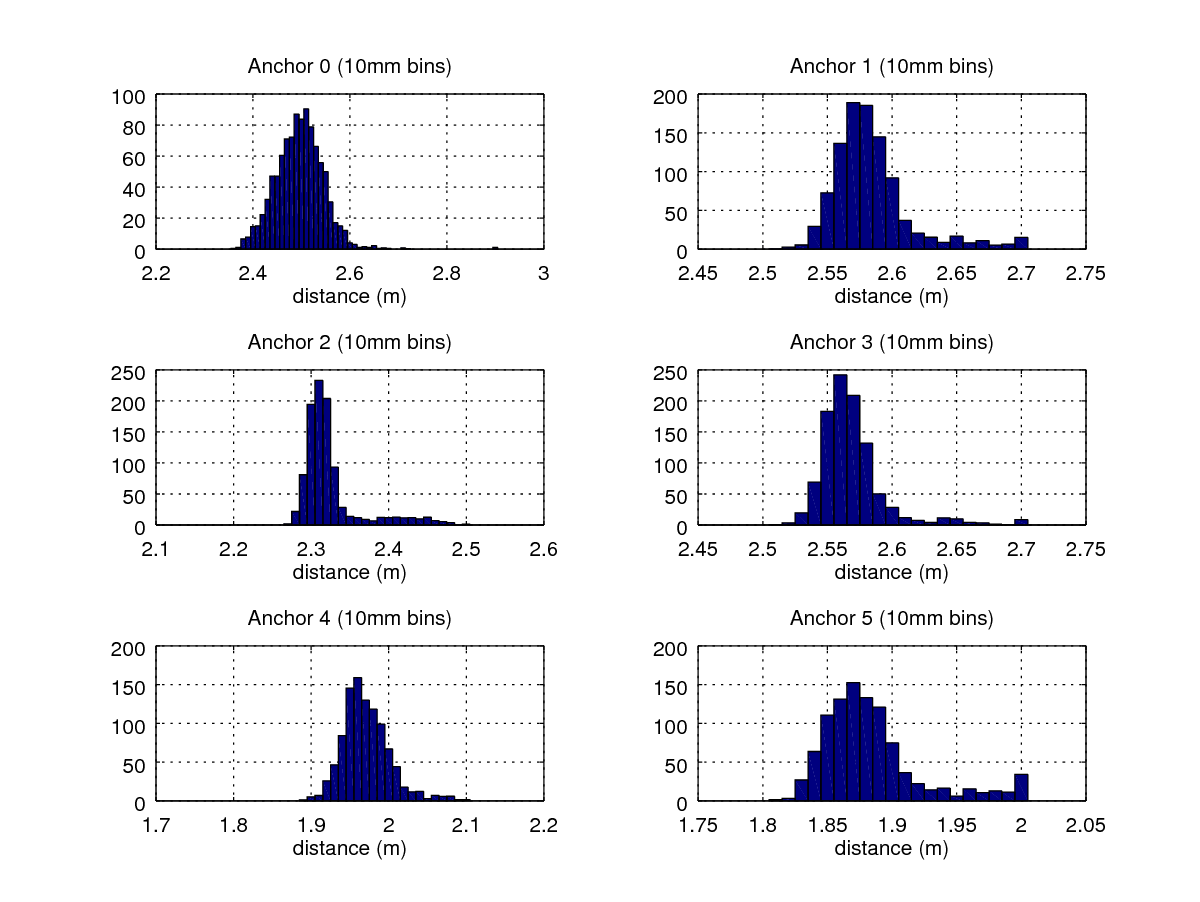
Raw range measurements
Physical distances from Crazyflie to anchors are calculated from positions of anchors and the Crazyflie.
Average and standard deviations are calculated on all data, including outliers.
The main part of the error should be caused by the antenna delay, expected to be the same for all anchors.
| Physical | Raw range measurements | |||
|---|---|---|---|---|
| Anchor | Distance | Average | Std dev | Err |
| 0 | 2.80 | 2.46 | 0.025 | 0.34 |
| 1 | 2.87 | 2.58 | 0.006 | 0.30 |
| 2 | 2.69 | 2.30 | 0.002 | 0.40 |
| 3 | 2.77 | 2.55 | 0.017 | 0.22 |
| 4 | 2.27 | 1.97 | 0.041 | 0.29 |
| 5 | 2.20 | 1.90 | 0.008 | 0.30 |
Histogram over raw range measurements