The plotter tab can be used to visualize data logged from the Crazyflie.
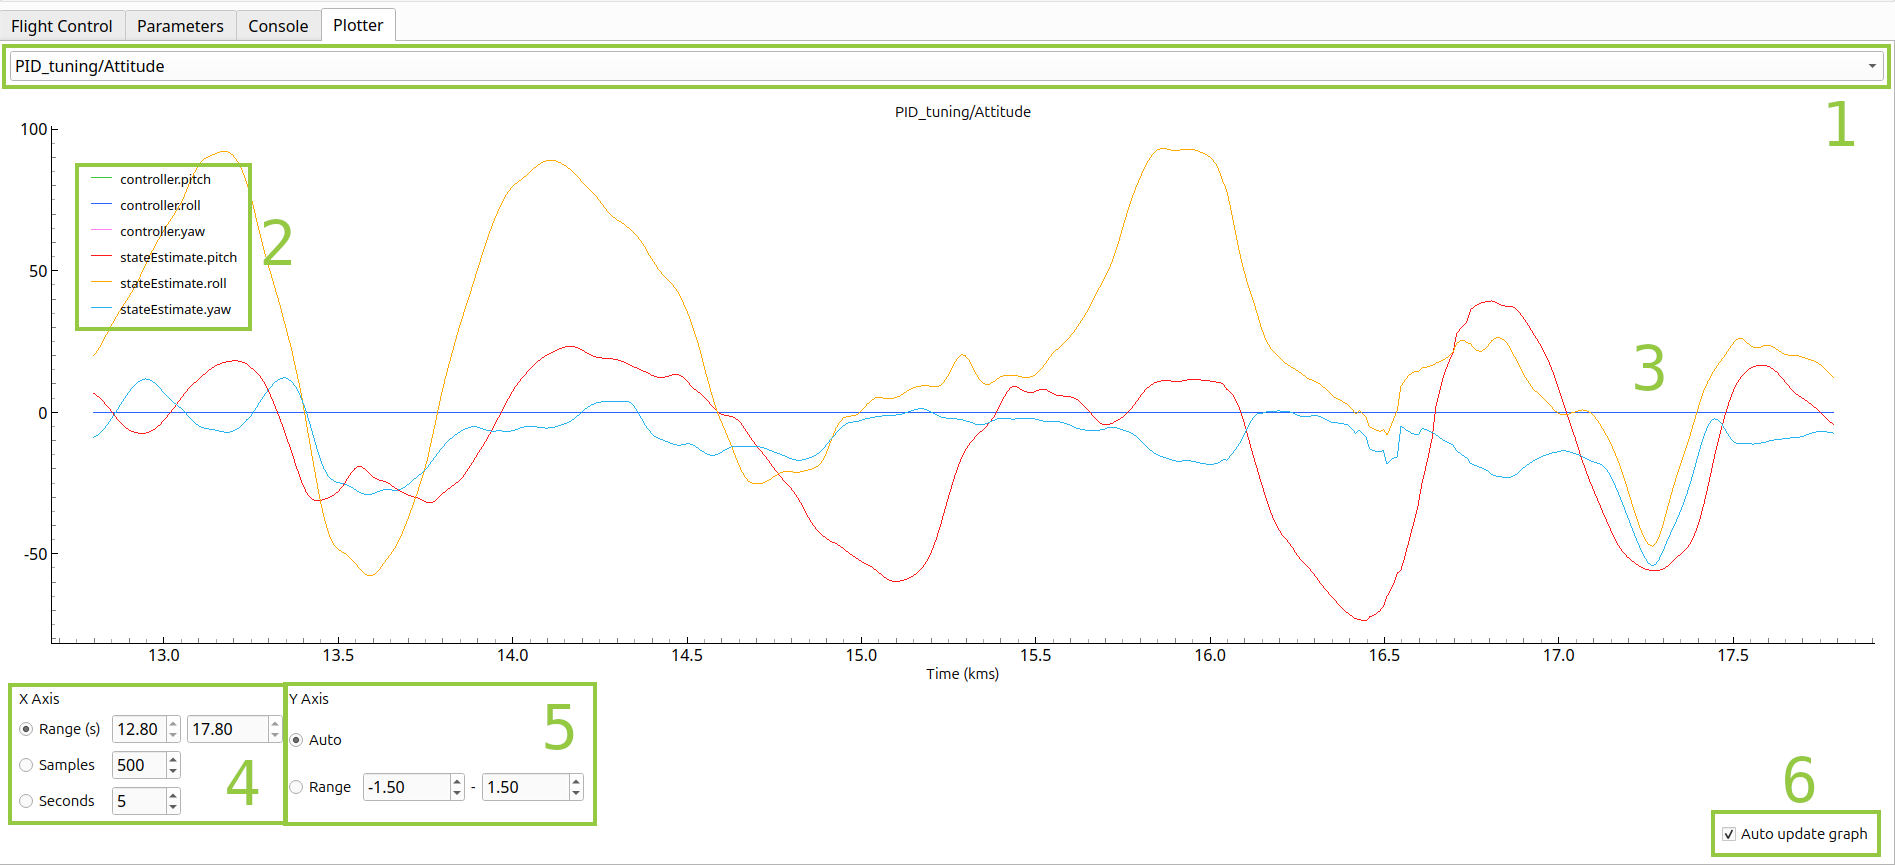
- Select logging configuration to plot. Read about how to create configurations here.
- Legend for the logging configuration that is being plotted.
- Logged data, zooming and panning can be done with the mouse.
- X-axis manipulation. Either a custom time range, a number of samples, or number of seconds can be used. If number of samples or seconds is used, the plot fills up the window and will start scrolling the data.
- Auto-scaling or fixed scaling for the Y-axis
- Auto update graph. If this is disabled the plot will stop updating (but data will still be collected in the background)