The Lighthouse Positioning tab shows information from the Lighthouse Positioning system when present. It is also used to set up and manage the system. To properly set up your system, please follow the getting started tutorial. For more information on how the Lighthouse system works, please see the firmware documentation.
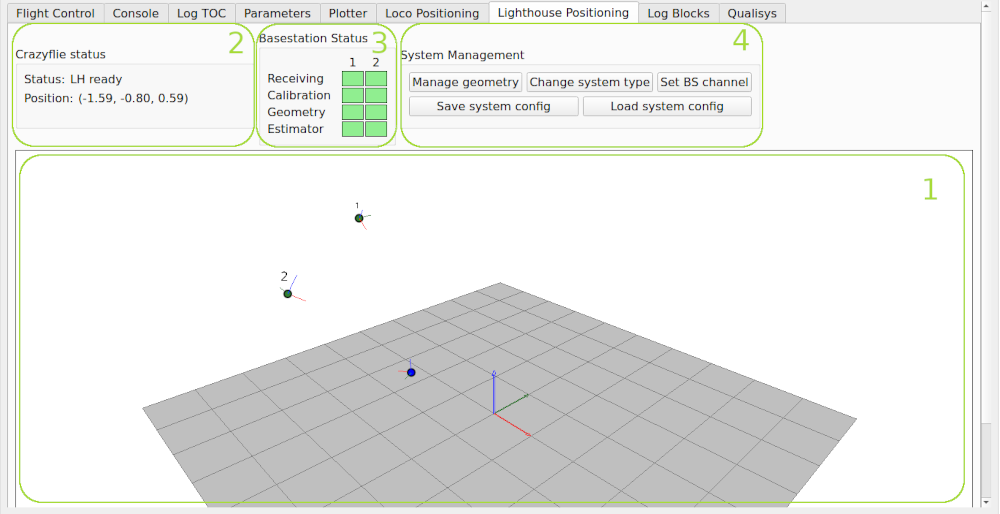
The tab is divided into four sections:
- Crazyflie Status
- System Management
- Base Station Status
- 3D view of the Crazyflie and the base stations
1. Crazyflie Status
The overall status of the Lighthouse system is displayed as a text. The status is one of:
- LH ready - one or more base stations are received and the information is used to estimate the position of the Crazyflie.
- Not receiving - no base station is received.
- No geo/calib - calibration or geometry data is missing and position can not be estimated.
The estimated (x, y, z) position for the Crazyflie is displayed in the “Position” field in meters.
2. System Management
This section is used to configure the system.
-
Start set up - Expands the Lighthouse tab with new sections for setting up a Lighthouse positioning system. See the System Set up section.
-
Switch BS version - Opens a dialog box where the base station version can be changed. Possible options are Lighthouse V1 and Lighthouse V2.
-
Set BS channel - Opens a dialog box that is used to set the channel of a Lighthouse V2 base station. Connect one base station at a time to the computer via USB and click the Scan base station button. If a base station is detected, a new channel can be set by choosing the desired channel and clicking the “Set channel” button.
- Import configuration - upload a system configuration to the Crazyflie from a file. The system configuration contains system type, calibration and geometry data. When a system configuration is uploaded from a file it is automatically written to the Crazyflie (and is stored in persistent memory). This is a useful feature when configuring multiple Crazyflies, making sure they all share the same coordinate system.
- Export configuration - store a system configuration from the Crazyflie to a file.
3. Base Station Status
A detailed status of the base stations is indicated using colors in the grid.
- Receiving - indicates that the Crazyflie is receiving signals from the base station.
- Green = signals are received
- Red = no reception
- Calibration - indicates if there is calibration data for the base station or not.
- Red = no calibration data
- Blue = calibration data from persistent storage but not yet confirmed
- Green = calibration data has been received from the base station and matched previous data
- Orange = calibration data has been received from the base station but did not match the previous data, this means that you might need to redo the geometry estimation.
Note: when Calibration data is received it is automatically stored in the persistent memory to be available after reboot.
- Geometry - indicates whether geometry data is available or not.
- Green = geometry data from persistent storage
- Red = no geometry data.
Note: it is possible that the geometry indicator is green even though the geometry data is not valid, this is for instance the case if a base station is replaced by another one with the same channel.
4. 3D view
The view displays the position and orientation of the Crazyflie (blue dot) and the base stations. Each base station is labeled with its ID, and its status is indicated by color:
- Green = signals are received
- Red = no reception
System Set up
This part of the tab appears when the Start set up button is pressed.
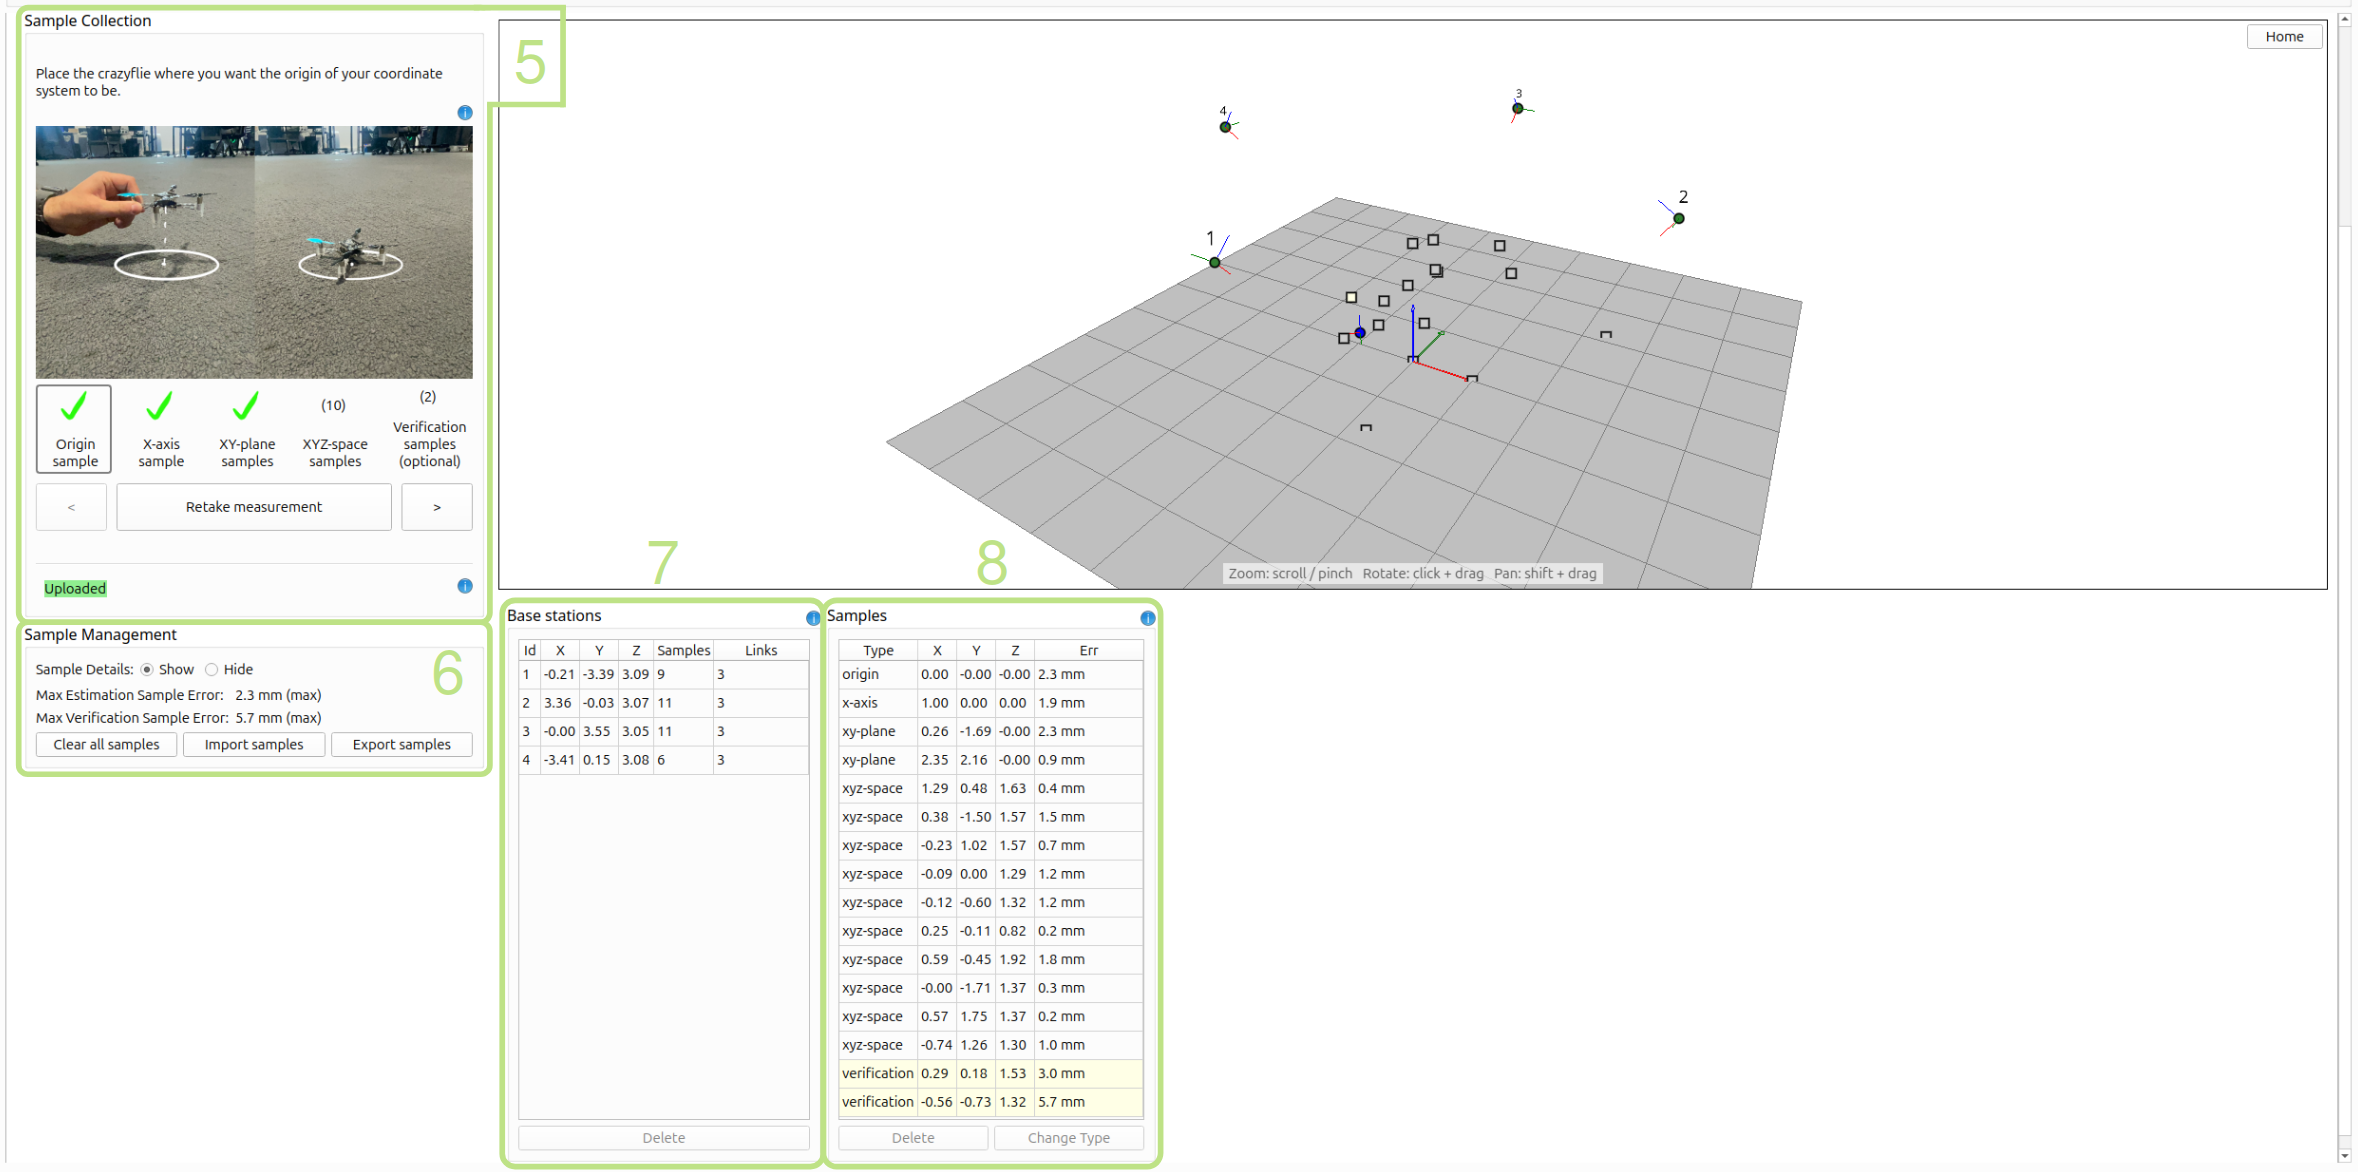
When setting up the system, four new sections appear:
- Sample collection
- Sample management
When show sample details is activated:
- Base stations table
- Samples table
5. Sample Collection
This section guides you through collecting the position samples used to estimate the geometry of the base stations. The process follows a fixed sequence of five steps:
- Origin sample - Place the Crazyflie at the desired origin of your coordinate system and take a measurement.
- X-axis sample - Place the Crazyflie 1m along the positive X-axis from the origin and take a measurement.
- XY-plane samples - Place the Crazyflie anywhere in the XY-plane (but not on the X-axis) and take one or more measurements. This maps the XY-plane to the floor.
- XYZ-space samples - Carry the Crazyflie to positions within the intended flight space and take samples by quickly rotating it left–right around the Z-axis, then holding it still.
- Verification samples (optional) - Taken the same way as XYZ-space samples. Used to check the accuracy of the geometry estimate at locations not used during estimation.
Use the arrow buttons “<” and “>” to navigate between steps. The large button between the arrow buttons triggers the measurement for the current step. For the first three steps, a step icon shows a checkmark when enough data has been collected for a valid solution.
A status label at the bottom of the section reflects the current state of the geometry solution:
- Not enough samples - more samples are needed before a solution can be computed.
- Updating… - the solver is recalculating the geometry.
- Uploading… - a valid solution has been found and is being written to the Crazyflie.
- Uploaded - the geometry has been successfully written to and confirmed by the Crazyflie.
- Uploaded (imported config) - a configuration was loaded from file and written to the Crazyflie.
6. Sample Management
This section shows the quality of the current geometry solution and provides tools for managing the collected samples.
- Sample Details - Toggle Show/Hide to reveal or collapse the Base Stations and Samples tables.
- Max Estimation Sample Error - The maximum crossing-beam error across all estimation samples. The estimation samples include the origin, X-axis, XY-plane, and XYZ-space samples.
- Max Verification Sample Error - The maximum crossing-beam error across all verification samples. Gives a practical measure of accuracy at positions not used during estimation.
- Clear all samples - Discards all collected samples and starts a fresh session.
- Import samples - Loads a previously saved sample session from a YAML file.
- Export samples - Saves the current sample session to a YAML file for later reuse or sharing between Crazyflies.
7. Base Stations table
Visible when Sample Details is set to Show. Displays a table of all base stations detected from the collected samples, with columns: Id, X, Y, Z (estimated position in metres), Samples (number of samples that saw this base station), and Links (number of connections to other base stations). A red highlight in the Links column means too few links exist, which prevents a valid geometry solution.
- Delete - Removes the selected base station and all its connections from the estimation. Samples that only observed this base station and one other are also removed.
8. Samples table
Visible when Sample Details is set to Show. Displays a table of all collected samples, with columns: Type, X, Y, Z (estimated position in metres), and Err (crossing-beam error in mm). Verification samples are shown with a yellow background. A large error in the Err column is highlighted in red; adding more XYZ-space samples nearby or retaking the affected sample can reduce it.
- Delete - Removes the selected sample from the table and the solution.
- Change Type - Switches the selected sample between XYZ-space and Verification type.
Estimation and Verification samples are also drawn in the 3D view, represented by grey and white squares respectively.