Introduction
To do modeling, simulations or to improve the flight algorithms the physical parameters of the Crazyflie system are good to know. This page lists several papers related to this, plus some internal investigations by Bitcraze itself.
External research on System Identification Crazyflie
Here is a list of papers of several external contributors and universities doing system identification on the Crazyflie 2.1:
- Shi, G., Hönig, W., Shi, X., Yue, Y., & Chung, S. J. (2021). Neural-swarm2: Planning and control of heterogeneous multirotor swarms using learned interactions. IEEE Transactions on Robotics, 38(2), 1063-1079. pdf
- Förster, Julian. System identification of the crazyflie 2.0 nano quadrocopter. BS thesis. ETH Zurich, 2015. pdf
Measurements by Bitcraze (2021)
Based on this blogpost
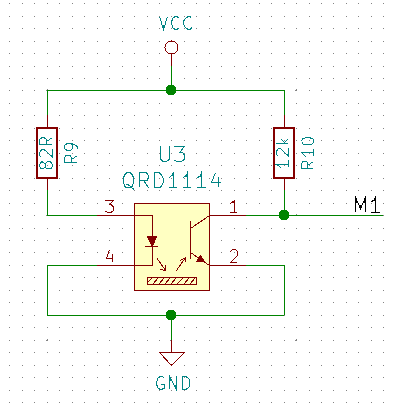
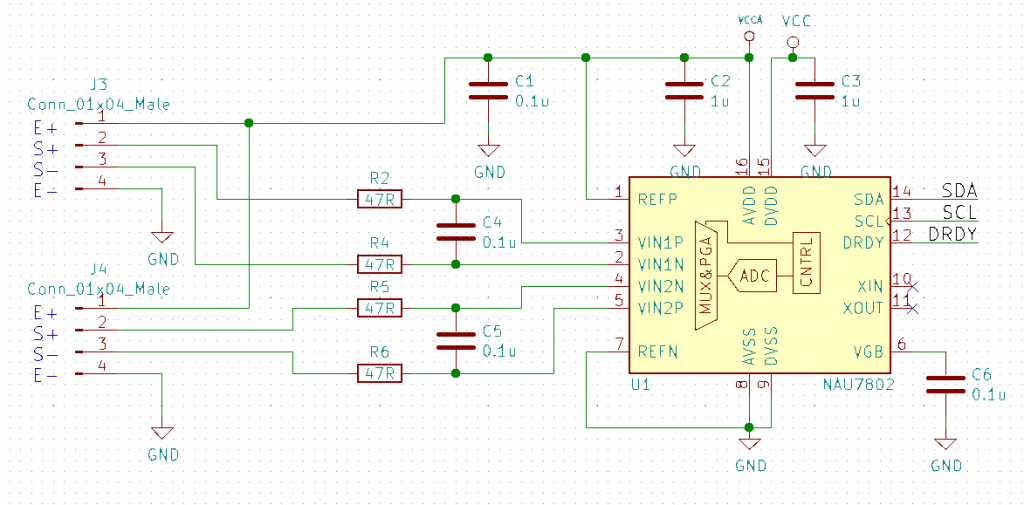
For the RPM sensors we used the same as on the RPM-deck, the QRD1114. They are not great as they need a reflective surface, this means adding white stickers or paint to black propellers, but they work well enough. The load cell amplifiers ended up to be the NAU7802 as it has a high accuracy and sample rate. For power metering we chose the new ACS37800 power monitoring IC that can handle up to 30A, this looked exciting.
The QRD1114 we wired the same way as previously done on the RPM-deck:
The NAU7802 was configured as per the datasheet suggestion and similarly to other open designs out there:
The ACS37800 is configured like this:
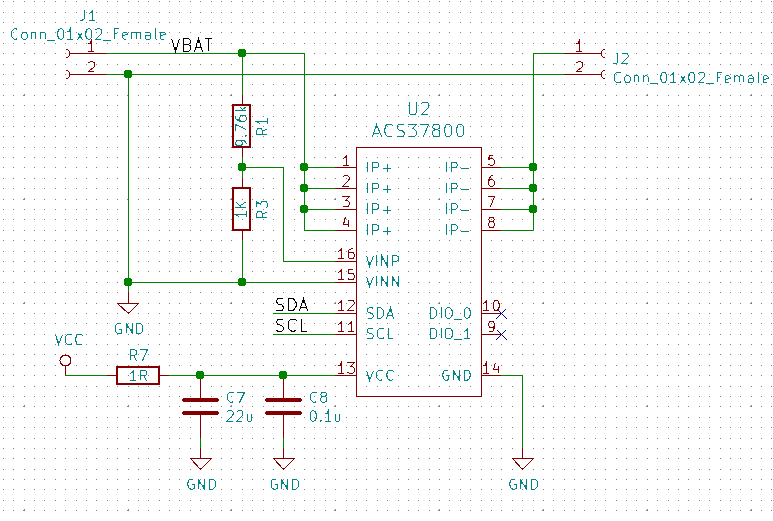
We also added a buck/boost DC/DC that could provide a stable 3.3V from 2-5V input, just in case, as the ACS37800 is specified for this voltage and not the 3.0V the Crazyflie can supply.
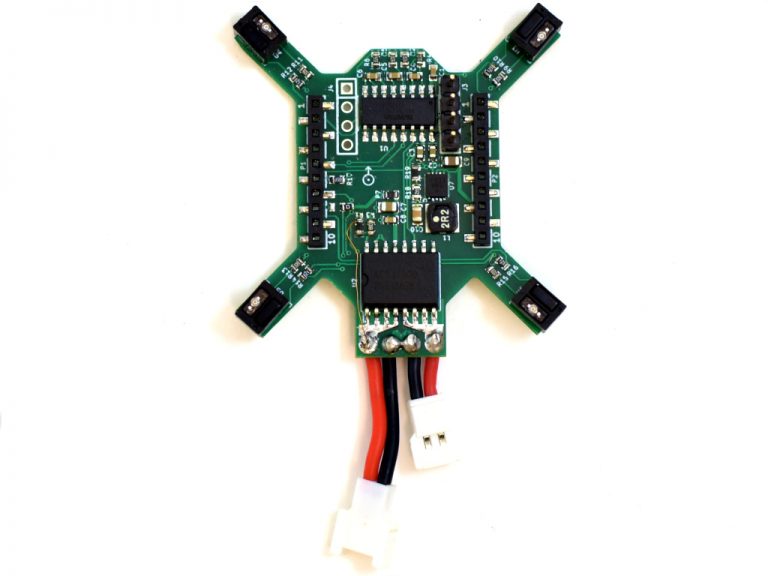
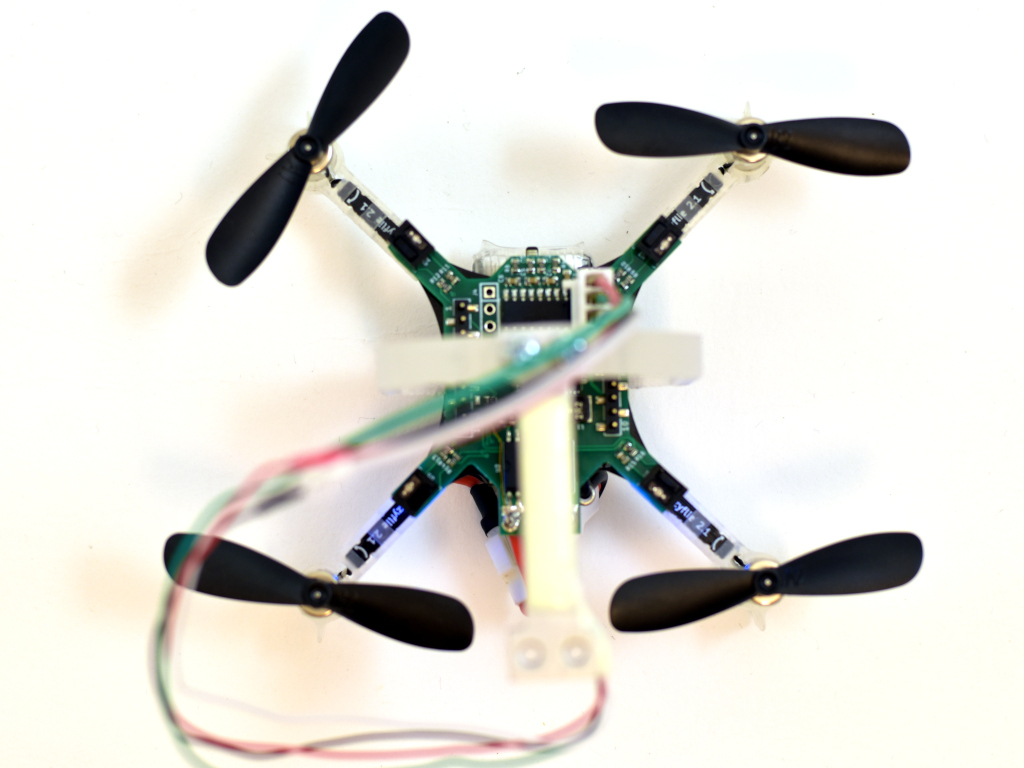
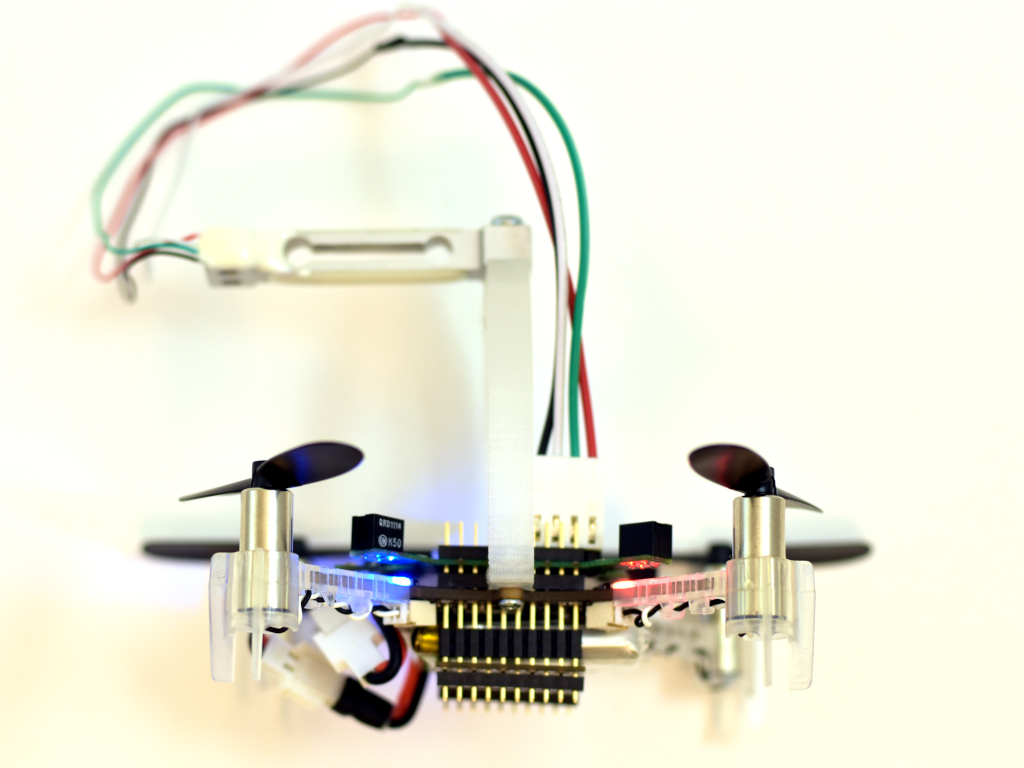
Mounted on the crazyflie
Here it is mounted on a Crazyflie 2.1 together with a 3D printed stand and load cell.
Software
The software, as often, took most of the time to make. Three major deck driver files were created, rpm.c, acs37800.c and loadcell_nau7802.c. Aside from these there were only small changes to make, like making it work when being up-side-down. The modifications have all been pushed to the dev-systemid branch for those who are interested. As for now we are mainly using the logging framework to transfer the data to the PC, which is quick and easy to setup and use, but writing to SD-card is also possible. The scripts for this can be found in the tools/sytem_id folder.
Old measurements (2015)
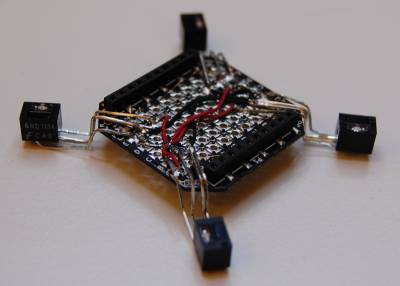
Measuring the RPM
To measure the RPM we used optical switches that we connected to a prototype board. Details can be found in this blog post. The firmware was then modified to measure the timing of the optical switches, convert them to RPM and make them available to the log subsystem. The log subsystem was also “hacked” so that more frequent samples could be taken (500Hz instead of max 100Hz)
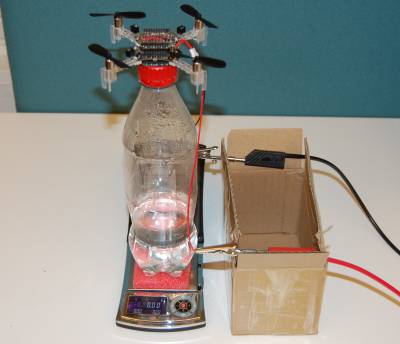
Measuring the thrust
To measure the thrust we built a simple test fixture. We use a precise scale to measure the thrust. It is done by letting a weight hold the Crazyflie 2.x down that is standing on the scale. The lift generated will show up on the scale as the total weight gets lighter. We glued a prototype expansion board to a bottle which we could attach the Crazyflie 2.x to. It is not a perfect fixture but shouldn’t be too far off.
Measuring amps and voltage
Voltage measurements is already done in firmware but amps had to be measured using an multimeter in series with the power source. Later it would be nice to add this to the RPM board so it could be measured during flight.
Thrust measurement
The firmware was adjusted to increase the trust from 0% to 93.75% in 16 steps. Each step period was set to four seconds so that thrust and amps could be manually written down. The cfclient was setup to log the PWM, voltage and RPM during the same time.
| Amps | Thrust (g) | Voltage | PWM (%) | Average RPM |
|---|---|---|---|---|
| 0.24 | 0.0 | 4.01 | 0 | 0 |
| 0.37 | 1.6 | 3.98 | 6.25 | 4485 |
| 0.56 | 4.8 | 3.95 | 12.5 | 7570 |
| 0.75 | 7.9 | 3.92 | 18.75 | 9374 |
| 0.94 | 10.9 | 3.88 | 25 | 10885 |
| 1.15 | 13.9 | 3.84 | 31.25 | 12277 |
| 1.37 | 17.3 | 3.80 | 37.5 | 13522 |
| 1.59 | 21.0 | 3.76 | 43.25 | 14691 |
| 1.83 | 24.4 | 3.71 | 50 | 15924 |
| 2.11 | 28.6 | 3.67 | 56.25 | 17174 |
| 2.39 | 32.8 | 3.65 | 62.5 | 18179 |
| 2.71 | 37.3 | 3.62 | 68.75 | 19397 |
| 3.06 | 41.7 | 3.56 | 75 | 20539 |
| 3.46 | 46.0 | 3.48 | 81.25 | 21692 |
| 3.88 | 51.9 | 3.40 | 87.5 | 22598 |
| 4.44 | 57.9 | 3.30 | 93.75 | 23882 |
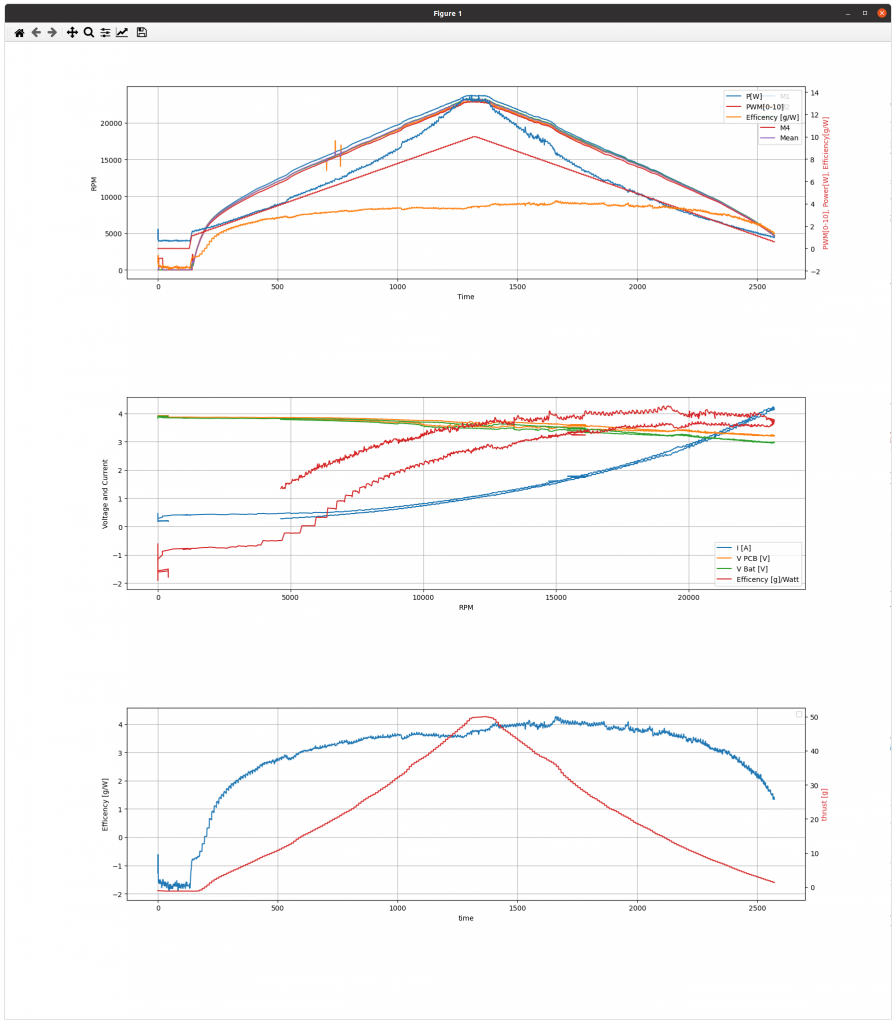
Observations
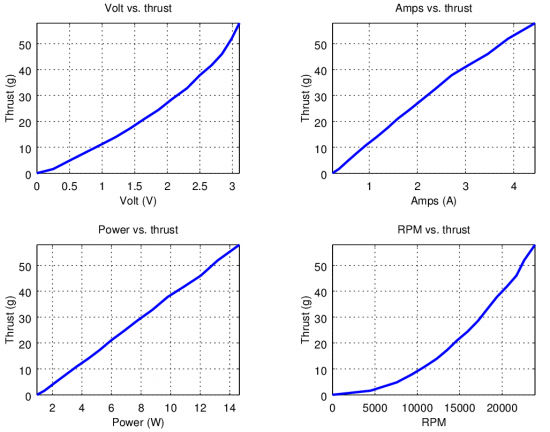
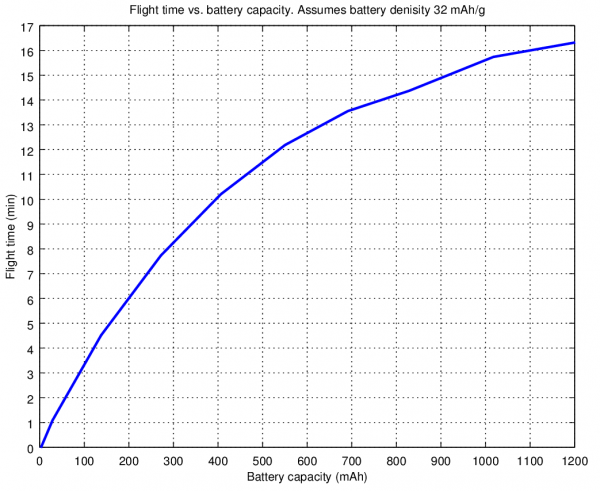
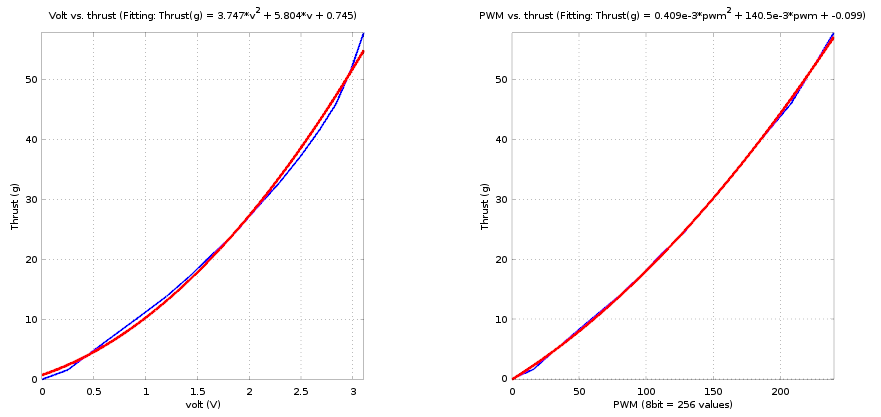
As it can be seen from the graph both then RPM and voltage vs. thrust is quadratic while the power vs. thrust is linear. Also from the figures one can see that at 93.75% PWM the trust is about 58g. Using the values some interesting plots can be made. Like estimated flight time vs. battery capacity.
What can also be plotted and estimated is the PWM to thrust transfer function. The issue is that it is not the “PWM” that drives the motors but the voltage and amps = power. With the PWM it is possible to simulate different voltage levels so we are making the assumption that 50% PWM would result in 50% voltage. Then comes the issue that the battery has an internal resistance so that the voltage level won’t be constant but will drop with the size of the load. This can be seen by plotting PWM and voltage. The graph is based on the values from the table above. The voltage supply used in this setup was a power box so the “internal resistance” of the battery is not really there but instead the resistance of the cables.
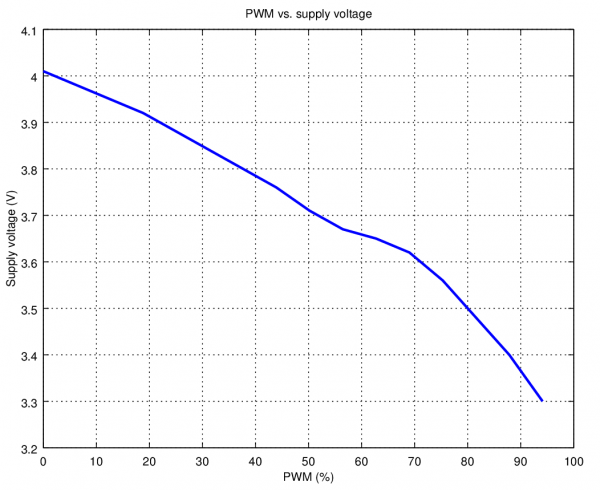
So when we are applying the PWM the voltage will be a percentage of the supply voltage which is based on the load which complicates things even more. Therefore two plots were made, one with voltage and another with PWM. The voltage that is applied to the motors is calculated as a percentage of the measured supply voltage. A strange thing here is that the fitting is a better matches to the PWM then to the voltage. Something that has to be investigated further.
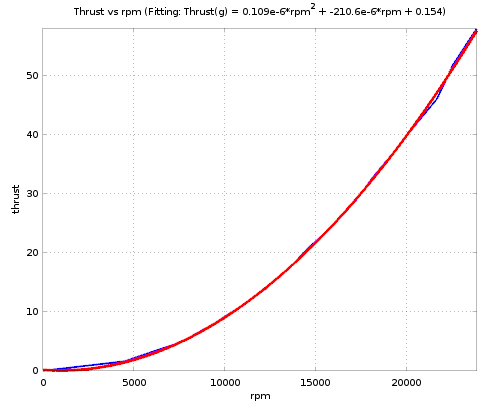
Another quite interesting curve is the rpm to thrust. The polyfit function gives the values: 1.0942e-07rpm^2 - 2.1059e-04rpm + 1.5417e-01.
Battery compensation
To get an even flight independent of the battery charge we compensate for the drop in voltage using data similar to the above. Read more about the battery compensation here.