Debugging the Crazyflie using the debug-adapter kit gives you direct access to the STM32 with a hardware debugger. It makes it possible to pause execution, step through code, and inspect what’s happening in real time.
Even if you’re working mostly at a higher level, having this kind of visibility can be a huge time-saver when something unexpected happens. It’s a tool frequently used when tracking down firmware issues or verifying low-level behavior.
This page covers debugging the STM32 using ST-LINK and J-Link debuggers with VS Code and Eclipse. It supports Crazyflie 2.x and 2.1 Brushless platforms. Debugging the nRF51 chip requires a different configuration, but an otherwise identical set-up.
NOTE: Debugging requires our debug adapter and an ST-LINK V2 debugger, J-Link probe, or similar.
Debug Build
Before debugging, you should build the firmware with optimizations disabled. By default, firmware is built with compiler optimizations that improve performance but make debugging difficult - breakpoints won’t land where expected, stepping becomes unpredictable, and variables may not be visible.
Enable a debug build by setting the CONFIG_DEBUG option in your Kconfig configuration. You can do this, for example, by running make menuconfig in a terminal. Then navigate to Build and debug options, and select Enable debug build. After changing Kconfig options, rebuild and flash the firmware with the new configuration.
Debugging in VS Code
Hardware
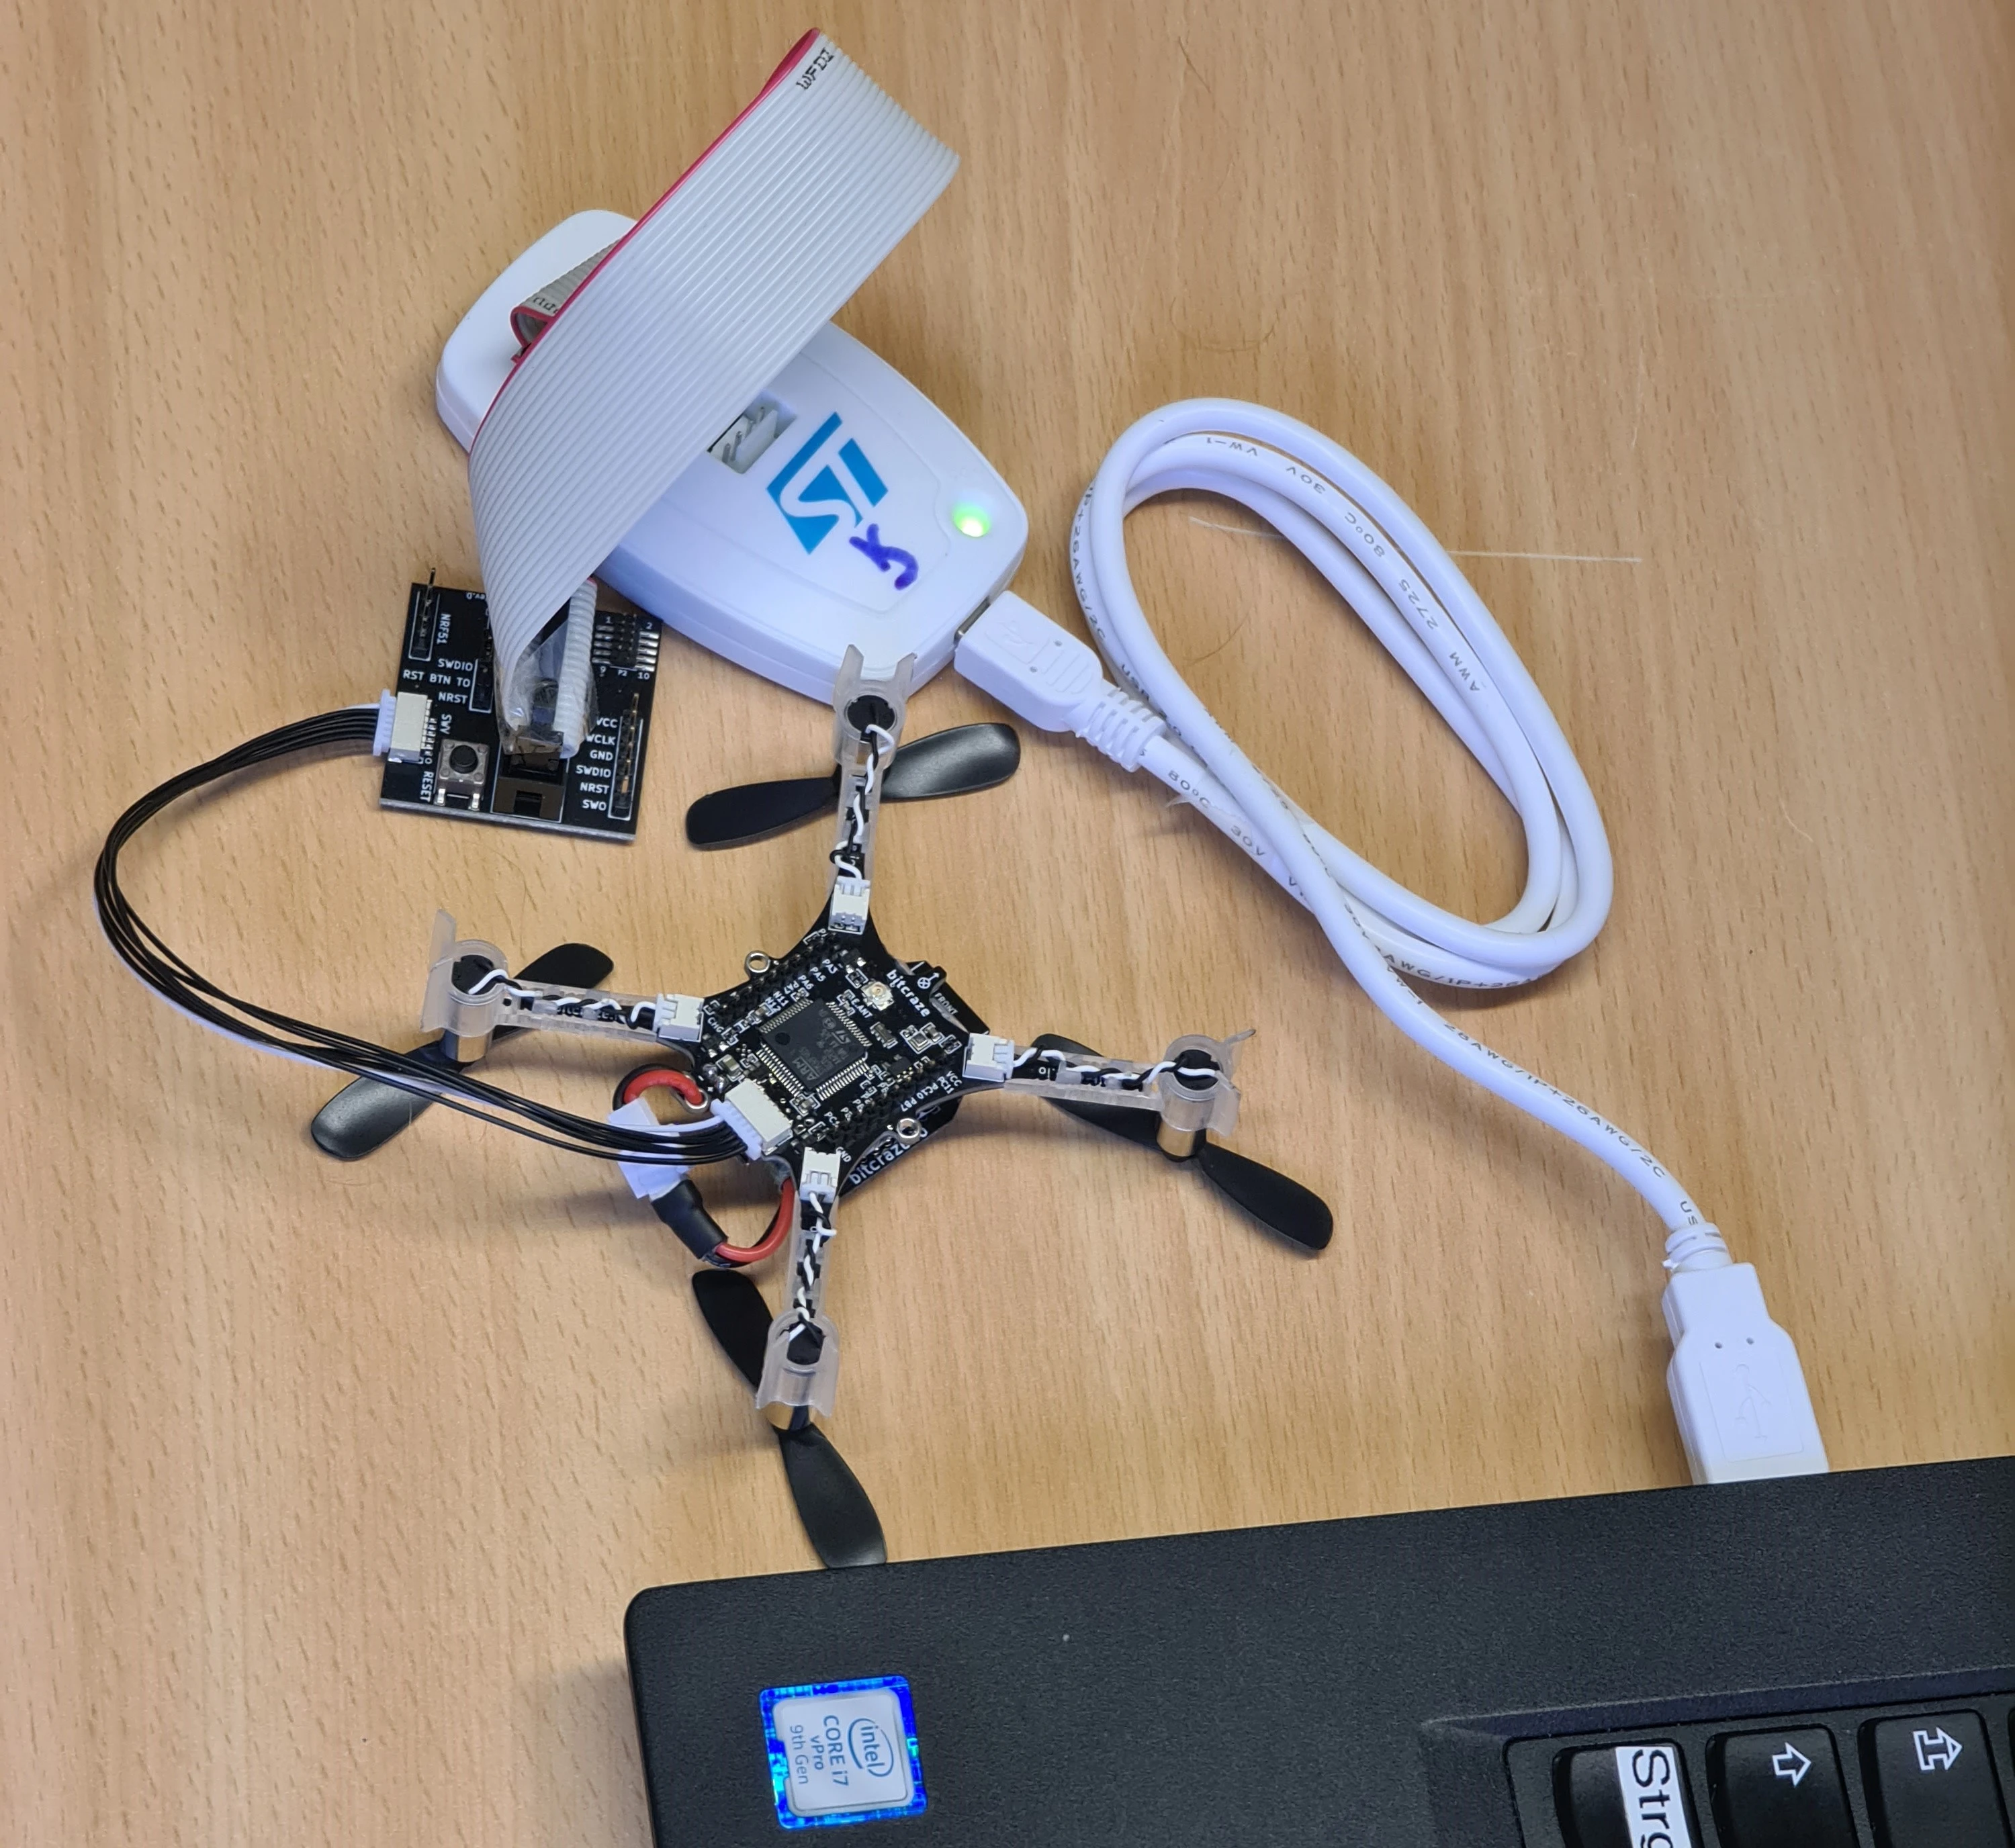
Connect the Crazyflie to your ST-LINK V2 or J-Link via the Debug Adapter and the port on the underside. You don’t need to solder the second adapter to the drone if you’re only planning on debugging the STM32F405 with the crazyflie-firmware.
Prerequisites
Ubuntu
Install OpenOCD, the ARM GCC toolchain, and gdb-multiarch, then create a symlink for compatibility:
sudo apt-get install openocd
sudo apt-get install gcc-arm-none-eabi gdb-multiarch
sudo ln -s /usr/bin/gdb-multiarch /usr/local/bin/arm-none-eabi-gdb
If you’re using a J-Link probe, you’ll need to install the J-Link software from Segger.
If you do not have VS Code yet, the easiest way to install it on Ubuntu is via snap using ‘Ubuntu Software’ or by typing:
sudo snap install --classic code
You will also need to add the debugger to the udev rules if not already done - for this you can check with lsusb what the ID of your debugger is (for an ST-LINK/V2 it should be 0483:3748). Then you can add it to a rules file, for example for the ST-LINK/V2 you could append the line
SUBSYSTEM=="usb", ATTRS{idVendor}=="0483", ATTRS{idProduct}=="3748", MODE="0664", GROUP="plugdev"
to the Crazyflie rules in “/etc/udev/rules.d/99-bitcraze.rules”.
Windows (Ubuntu in WSL)
Install Windows Subsystem for Linux (WSL)
Configure your Machine for WSL and install a Ubuntu Distribution. Instructions can be found here: https://learn.microsoft.com/en-us/windows/wsl/install.
Install the GCC ARM Embedded Application Binary Interface (eabi) Toolchain
Update Apt
sudo apt update
Install Make
sudo apt install make
Install gcc arm eabi
sudo apt install -y gcc-arm-none-eabi
Install build-essential
sudo apt install build-essential -y
Clone the crazyflie-firmware, build and upload it to your Crazyflie
Clone the firmware from github to your local WSL filesystem
git clone --recursive https://github.com/bitcraze/crazyflie-firmware.git
Move in the project directory
cd crazyflie-firmware
Make the .config file from defconfig
make defconfig
Compile the project (-j 16 means use 16 threads, 2 x processor cores is a good rule of thumb)
make all -j 16
Upload the code to your Crazyflie by typing
make cload > **_NOTE:_** > This method uses windows python program to upload the binary. So make sure that you have python, the cfclient and its all dependencies installed under windows and that you're able to connect to the crazyflie via the cfclient and Crazyradio PA(zadig!).
Visual Studio Code
Make sure you have Visual Studio Code installed in Windows, do not install it in WSL! Get it here: https://code.visualstudio.com/ Once you have VSCode installed under Windows, go in WSL, cd into the crazyflie-firmware folder and execute the following command
code .
You should now see WSL Ubuntu installing the VS Code Server program. Shortly after, VSCode under Windows will launch with a remote connection to your WSL folder (green box down left).
NOTE: Note: In addition to the Arm-Cortex Debugging Extension (Version 1.2.2!), which is installed later in this instruction, you should also install Microsofts C/C++ Extension Pack and its recommended Extensions.
Attach the ST-LINK V2 USB device directly to WSL
Unlike make cload, which uses Windows programs to connect with USB devices like the Crazyradio PA, OpenOCD needs to communicate directly with your ST-LINK V2 in WSL. Simply connecting it to your Windows machine isn’t enough; you also need to attach it to WSL. To do this, you’ll need to install USBIPD on Windows. Follow the instructions on how to install USBIPD and how to attach a device to WSL.
Now make sure that it is connected to WSL by listing all usb devices with lsusb
Currently only the Superuser has read/write access to that usb device, change that by
sudo chmod +666 /dev/bus/usb/<busid, see lsusb>/<deviceid, see lsusb>- Example:
sudo chmod +666 /dev/bus/usb/002/003 - if you’re unsure, you can check the permissions with
ls -l /dev/bus/usb/<busid, see lsusb>/<deviceid, see lsusb>
The link to gdb-multiarch is required because Ubuntu does not ship arm-none-eabi-gdb anymore, but the new gdb-multiarch that supports all architecture.
sudo apt-get install openocd -y
sudo apt-get install gcc-arm-none-eabi gdb-multiarch -y
sudo ln -s /usr/bin/gdb-multiarch /usr/local/bin/arm-none-eabi-gdb
Mac OS
brew install open-ocd
brew tap PX4/homebrew-px
brew install arm-none-eabi-gcc
Install the Cortex Debug Extension
First ensure that you have the ARM GCC toolchain and OpenOCD installed and in your path. To check, run:
which openocd
which arm-none-eabi-gcc
The path to your OpenOCD binary and ARM GCC binary should output. If not, try installing them again.
Install the extension either by clicking “Install” on the web page, or by searching “Cortex Debug” in the Extensions tab of VS Code.
Click on “Run”, then “Add Configuration”, then “Cortex Debug”.
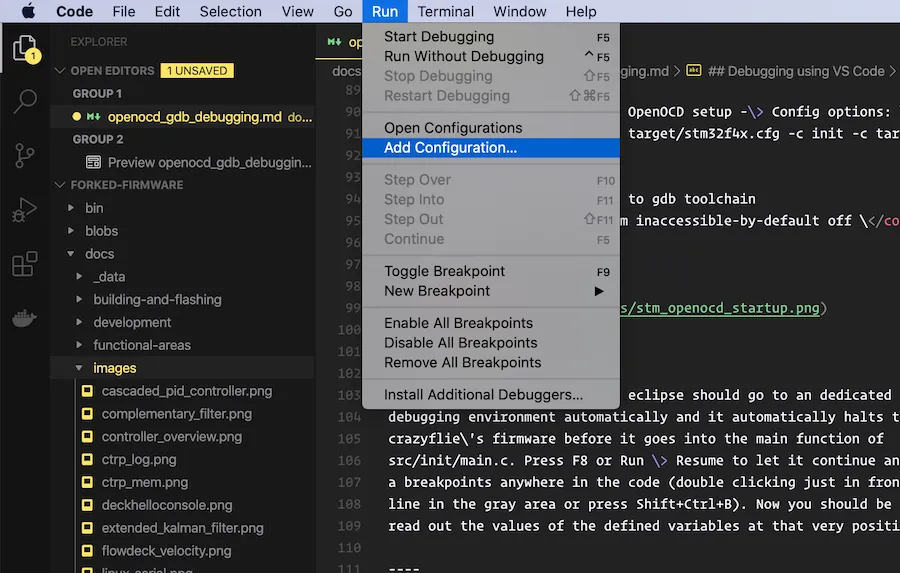
This should automatically create the needed “launch.json” file.
VS Code Debug Configuration
With debug builds enabled, you’ll get more predictable stepping and reliable breakpoints. The next step is setting up your debugger. Below is a launch.json configuration for VS Code that supports both ST-Link and J-Link, and works with Crazyflie 2.x and the 2.1 Brushless.
Inside of the file, replace everything with the following:
{
    // VS Code debug launch configurations for Crazyflie 2.x and 2.1 Brushless using J-Link and ST-LINK
    "version": "0.2.0",
    "configurations": [
        {
            // ST-LINK configuration for Crazyflie 2.x
            "name": "STLINK CF21 Debug",
            "cwd": "${workspaceRoot}",
            "executable": "${workspaceRoot}/build/cf2.elf",
            "request": "launch",
            "type": "cortex-debug",
            "device": "STM32F405",
            "svdFile": "${workspaceRoot}/tools/debug/STM32F405.svd",
            "servertype": "openocd",
            "configFiles": ["interface/stlink-v2.cfg", "target/stm32f4x.cfg"],
            "runToEntryPoint": "main",
            "preLaunchCommands": [
                "set mem inaccessible-by-default off",
                "enable breakpoint",
                "monitor reset"
            ]
        },
        {
            // ST-LINK configuration for Crazyflie 2.1 Brushless
            "name": "STLINK CF21BL Debug",
            "cwd": "${workspaceRoot}",
            "executable": "${workspaceRoot}/build/cf21bl.elf",
            "request": "launch",
            "type": "cortex-debug",
            "device": "STM32F405",
            "svdFile": "${workspaceRoot}/tools/debug/STM32F405.svd",
            "servertype": "openocd",
            "configFiles": ["interface/stlink-v2.cfg", "target/stm32f4x.cfg"],
            "runToEntryPoint": "main",
            "preLaunchCommands": [
                "set mem inaccessible-by-default off",
                "enable breakpoint",
                "monitor reset"
            ]
        },
        {
            // J-Link configuration for Crazyflie 2.x
            "name": "JLink CF2 Debug",
            "cwd": "${workspaceRoot}",
            "executable": "${workspaceRoot}/build/cf2.elf",
            "request": "launch",
            "type": "cortex-debug",
            "device": "STM32F405RG",
            "svdFile": "${workspaceRoot}/tools/debug/STM32F405.svd",
            "servertype": "jlink",
            "runToEntryPoint": "main",
            "preLaunchCommands": [
                "set mem inaccessible-by-default off",
                "enable breakpoint",
                "monitor reset"
            ]
        },
        {
            // J-Link configuration for Crazyflie 2.1 Brushless
            "name": "JLink CF21BL Debug",
            "cwd": "${workspaceRoot}",
            "executable": "${workspaceRoot}/build/cf21bl.elf",
            "request": "launch",
            "type": "cortex-debug",
            "device": "STM32F405RG",
            "svdFile": "${workspaceRoot}/tools/debug/STM32F405.svd",
            "servertype": "jlink",
            "runToEntryPoint": "main",
            "preLaunchCommands": [
                "set mem inaccessible-by-default off",
                "enable breakpoint",
                "monitor reset"
            ]
        },
        {
            // ST-LINK ATTACH for CF2 - for debugging already running firmware
            "name": "STLINK CF2 Attach",
            "cwd": "${workspaceRoot}",
            "executable": "${workspaceRoot}/build/cf2.elf",
            "request": "attach",
            "type": "cortex-debug",
            "device": "STM32F405",
            "svdFile": "${workspaceRoot}/tools/debug/STM32F405.svd",
            "servertype": "openocd",
            "configFiles": ["interface/stlink-v2.cfg", "target/stm32f4x.cfg"],
            "preLaunchCommands": [
                "set mem inaccessible-by-default off",
                "enable breakpoint"
            ]
        },
        {
            // ST-LINK ATTACH for CF21BL - for debugging already running firmware
            "name": "STLINK CF21BL Attach",
            "cwd": "${workspaceRoot}",
            "executable": "${workspaceRoot}/build/cf21bl.elf",
            "request": "attach",
            "type": "cortex-debug",
            "device": "STM32F405",
            "svdFile": "${workspaceRoot}/tools/debug/STM32F405.svd",
            "servertype": "openocd",
            "configFiles": ["interface/stlink-v2.cfg", "target/stm32f4x.cfg"],
            "preLaunchCommands": [
                "set mem inaccessible-by-default off",
                "enable breakpoint"
            ]
        },
        {
            // JLink ATTACH for CF2 - for debugging already running firmware
            "name": "JLink CF2 Attach",
            "cwd": "${workspaceRoot}",
            "executable": "${workspaceRoot}/build/cf2.elf",
            "request": "attach",
            "type": "cortex-debug",
            "device": "STM32F405RG",
            "svdFile": "${workspaceRoot}/tools/debug/STM32F405.svd",
            "servertype": "jlink",
            "preLaunchCommands": [
                "set mem inaccessible-by-default off",
                "enable breakpoint"
            ]
        },
        {
            // JLink ATTACH for CF21BL - for debugging already running firmware
            "name": "JLink CF21BL Attach",
            "cwd": "${workspaceRoot}",
            "executable": "${workspaceRoot}/build/cf21bl.elf",
            "request": "attach",
            "type": "cortex-debug",
            "device": "STM32F405RG",
            "svdFile": "${workspaceRoot}/tools/debug/STM32F405.svd",
            "servertype": "jlink",
            "preLaunchCommands": [
                "set mem inaccessible-by-default off",
                "enable breakpoint"
            ]
        }
    ]
}
To use this setup with a different platform, like the Flapper, just change the executable field to point to the correct .elf file. By default, starting a debug session in VS Code will erase and reflash the firmware, so make sure the firmware is built beforehand. If you need to attach to a running target without flashing, you’ll need to modify the launch.json to skip loading the binary.
Configuration notes:
svdFilerefers to the necessary file for peripheral registers to show up nicely in the debug pane, all named and structuredconfigFilesrefers to the files you need so that OpenOCD knows what device and interface you’re using; it should already come with themdevicerefers to the device you want to debugservertyperefers to the debugging server to use (openocd or jlink)runToEntryPointtells the GDB debug server to jump to main by defaultpreLaunchCommandsspecifies the commands for the GDB server to send before giving away control to you
Note: Debugging an App To debug an app, make sure to change the “executable” to “${workspaceRoot}/examples/app_hello_world/build/cf2.elf”, or to which app you would like to debug. You can add your app debugger as a separate configuration.
Note: Debugging thread aware To debug thread aware you need to add
"rtos": "FreeRTOS"to your configuration in the launch.json file - however, while this can be very handy we also occasionally experienced some issues with setting breakpoints while using this configuration.
Debug
After setup, go to the ‘Run and Debug’ tab of VS Code (on the left sidebar, the icon with the little bug next to the play button), select the chip you want to debug from the drop-down menu at the top of the pane, and hit the play button!
NOTE: Make sure your executable (cf2.elf) is identical to the one running on your Crazyflie.
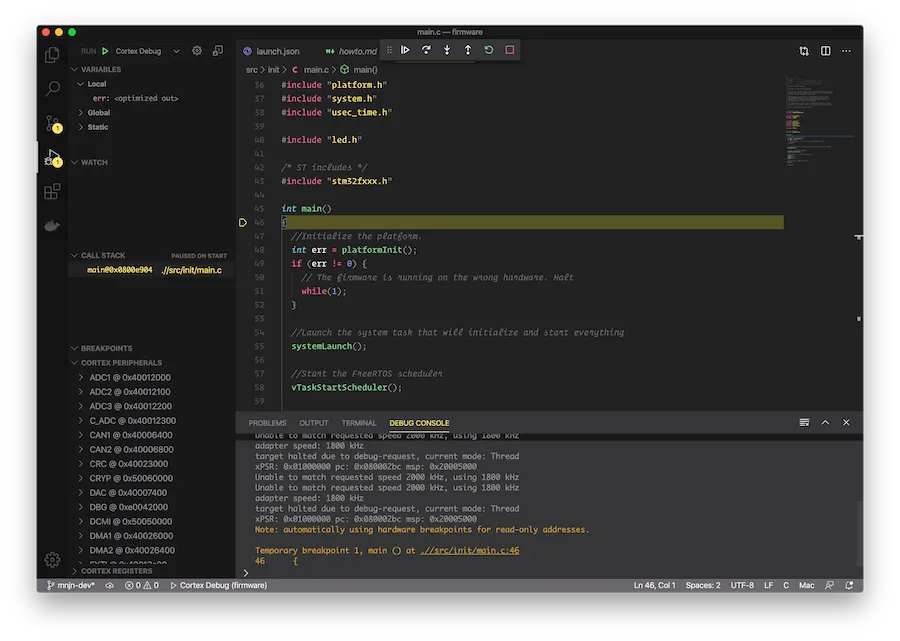
If you followed everything, it should start running nicely and look a little something like the image below. Notice the nice peripherals pane at the bottom, along with the variables pane at the top. Awesome, now you can code and debug all within VS Code!
Debugging in Eclipse
Ubuntu
Versions:
- Ubuntu 18.04.2 LTS (64 bit)
- Eclipse 2019-03 (Eclipse IDE for C/C++ Developers)
Installing prerequisites
First install GDB and openOCD:
sudo apt-get update
sudo apt-get install gdb
sudo apt-get install openocd
Then install java:
sudo apt install default-jre
Then install Eclipse itself: Go to their download page: Eclipse 20 and then go into you download folder and unzip the file.
tar -zxvf "your-downloaded-file".tar.gz
and start up Eclipse:
"YOUR-UNZIPPED-FOLDER"/.eclipse
Mac OS
Install gdb and openocd
brew install gdb
brew install open-ocd
Install Java JDK java download
Download Eclipse Eclipse download
Choose destination folders - Install
Run Eclipse and choose work folder
Installing required Eclipse plugins
The rest is the same as for Linux. Make sure that the arm-none-eabi-gcc is properly installed and its path is configured in the debug configurations.
Installing required Eclipse Plugins
Install the C++ development tools and GNU MCU plugin by following the instructions here.
- C++ Development - Follow the instructions under the header 'CDT'.
- GNU MCU plugin - Follow the instructions under the header 'Plug-ins install/update -> The Eclipse Marketplace way'
Import Crazyflie Firmware
First import the crazyflie-firmware into Eclipse:
- File > import…
- C/C++ > Existing Code as Makefile Project -> Next
- Give it a name
- Existing Code Location > Browse… > //Look for the firmware folder//
- //Toolchain for Indexer Settings// can be ignored.
- Finish
Setting up Eclipse Debugging environment
- Go to: Run > Debug Configurations...
- Double click 'GDB OpenOCD Debugging'
Now input the following settings in the debug configurations:
Main
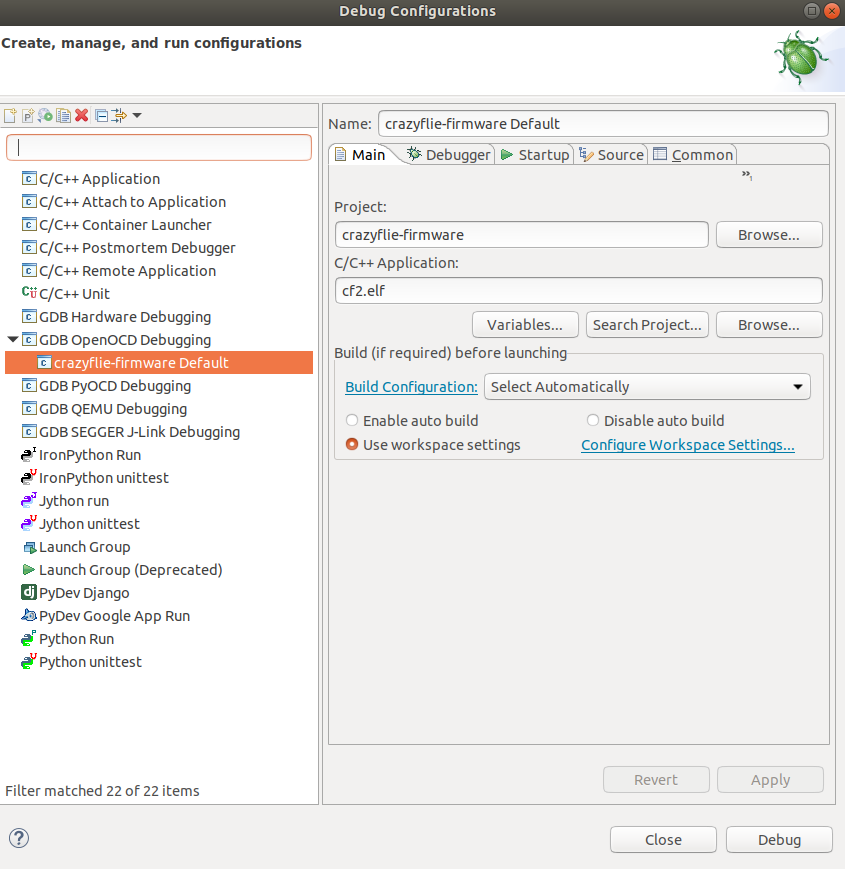
Insert the filepath to the cf2.elf file to C/C++ Application.
Debugger
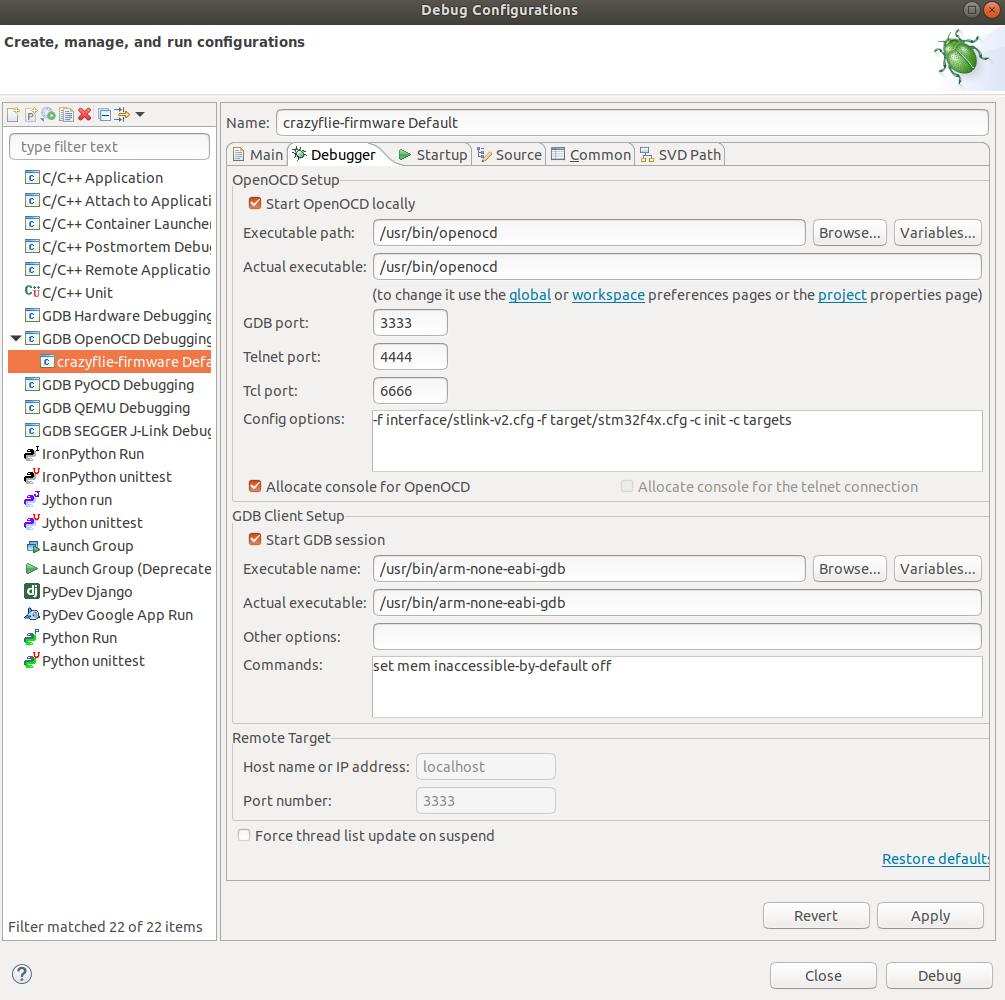
check the following settings: OpenOCD setup -> Config options: <code> -f interface/stlink-v2.cfg -f target/stm32f4x.cfg -c init -c targets </code> GDB Client Setup:
- Executable name: Filepath to gdb toolchain
- Commands: <code> set mem inaccessible-by-default off </code>
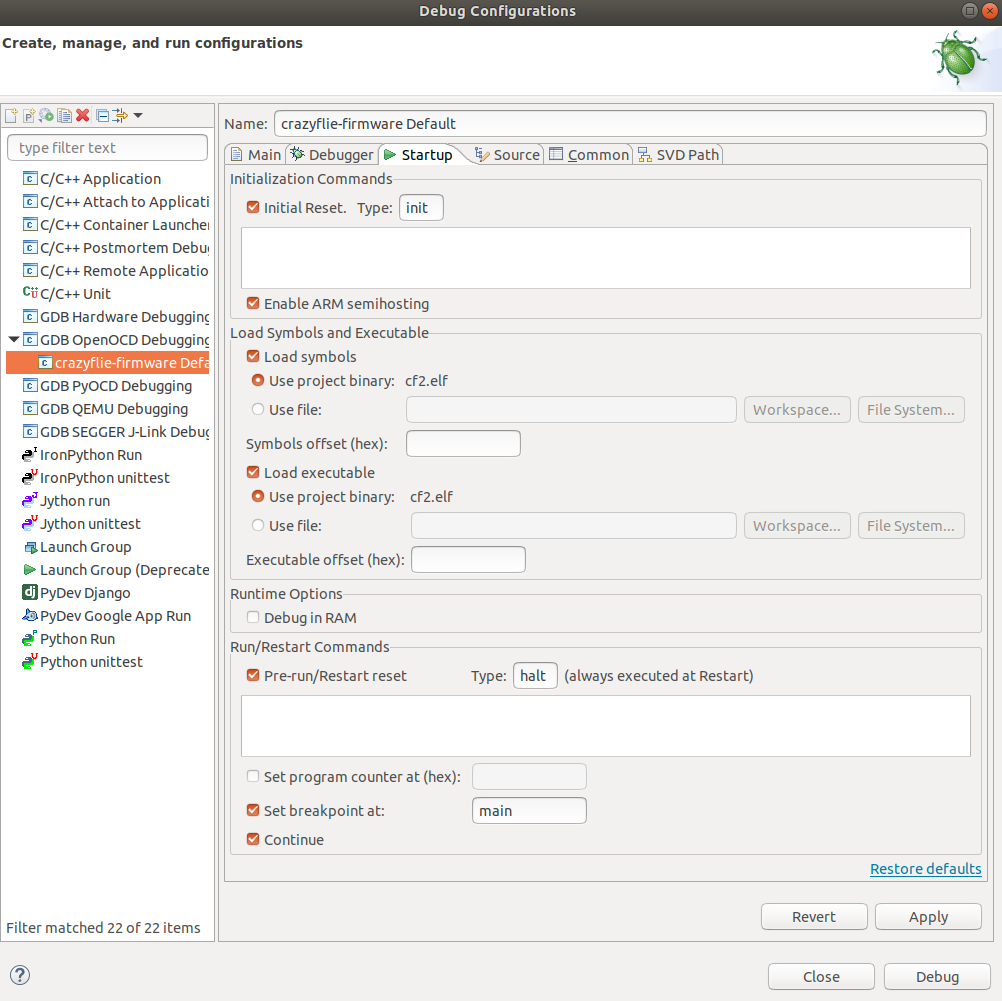
Startup
Debug!
If you don't see any errors, Eclipse should go to an dedicated debugging environment automatically and it automatically halts the crazyflie's firmware before it goes into the main function of src/init/main.c. Press F8 or Run > Resume to let it continue and place a breakpoints anywhere in the code (double clicking just in front of the line in the gray area or press Shift+Ctrl+B). Now you should be able to read out the values of the defined variables at that very position.
NOTE: Make sure your executable (cf2.elf) is identical to the one running on your Crazyflie.