We have finally gotten around to work a bit on the PlotTab in the cfclient. It’s been kind of working for a while, but there’s been lots of bugs and missing functionality. One thing that kept us back a bit was that we couldn’t decide what to do about the plot itself. Currently there’s a hackish implementation we did ourselves by drawing directly in the paint method of a QtWidget. This was done since PyQwt (QwtPlot) was too heavy for our netbooks. We have been looking around for a lib that supports “realtime” plotting and that’s not made for “static” plotting, but so far we haven’t found anything. The best alternative that we have found is PyQtGraph. It’s a pure Python lib that uses numpy and PyQt. We were a bit hesitant to bring in more dependencies, but we feel that PyQtGraph and numpy might be useful in other parts of the cfclient in the future. We are still working on the integration and when it gets a bit more stable we will merge it to the main branch.
With the PyQtGraph integration and the pull request from David to fix the reloading of the log configuration, we are hoping that the PlotTab will become a lot more useful. Below is a screenshot of the new PlotTab plotting the raw gyro output (logged at 100Hz) while hovering (and trying to press the PrintScreen button). The data that is plotted uses the time-stamp that is sent together with the data from the Crazyflie.
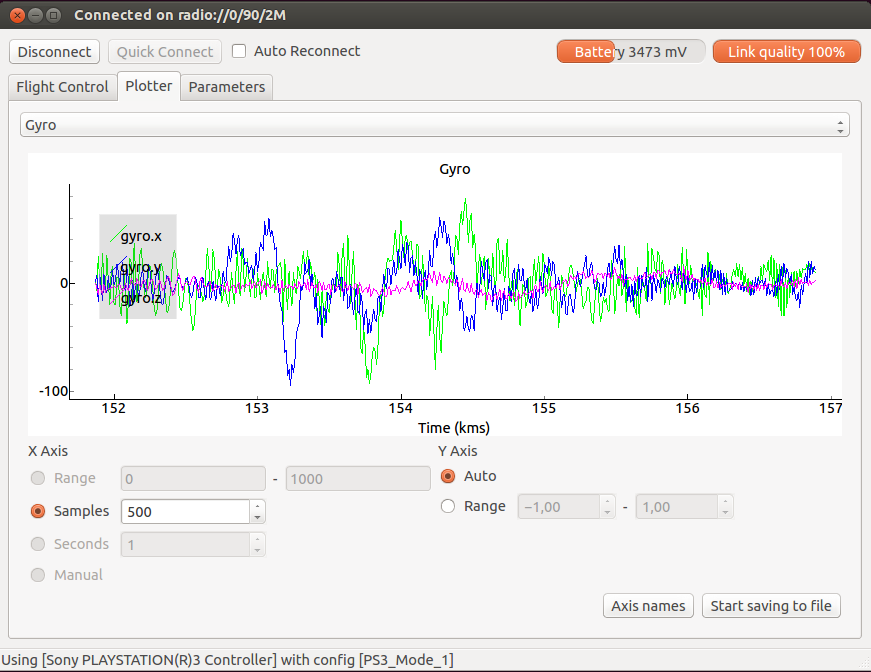
Raw gyro while flying