While working on the PyQtGraph integration we have also started looking a bit more at the logging. There’s two limitations that we would like to remove. The first is that it’s only possible to plot logging configurations that are created for the PlotTab, but there’s more configurations that are running in the background. For instance all the values in the FlightTab are received via the logging framwork, and there’s no reason for these values not being plottable on the PlotTab. The second one is that you can only save one logging block at a time (and you have to plot this). We will add a new tab that shows all the logging configurations that are active and also add the possibility to save any number of these to file. After selecting a directory for logging data, the files will be created and the data logged. The format will be CSV (as it is today) and the timestamp will be the Crazyflie ms tick. Using the common timestamp it will be possible to plot multiple files together in an external application (like SciLab or Octave). If you have any other suggestions for the plot/logging functionality let us know.
During this work we have noticed that there are some stability issues with the Param and Log frameworks. Sometimes no parameters are downloaded and sometimes there’s no data that is being logged. We have also seen that the Crazyflie reports that there’s no memory to add more configurations when connecting. Those will be worked out.
The Crazyflie Nano Quadcopter 10-DOF is out of stock at Seeedstudio, but we are expecting new units to arrive just before Christmas. But if you are eager to get one before then have a look at our distributor page.
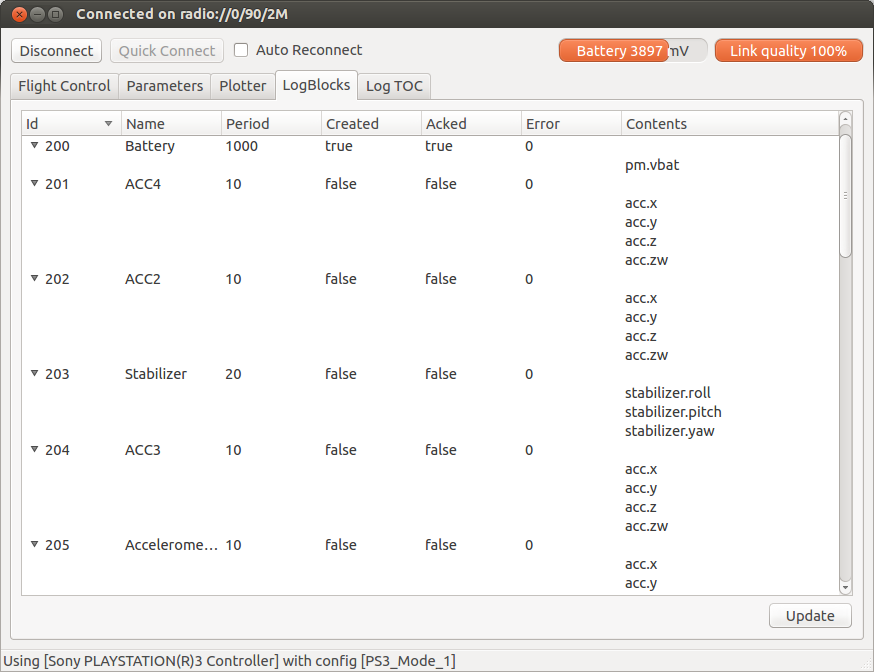
Log block debugging tab