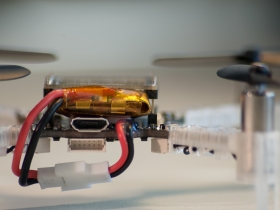
While designing the Crazyflie 2.0 one of our focuses has been enhancing the current Crazyflie functionality. As a flying development kit the current Crazyflie already has a JTAG debug port that allows to flash and debug the STM32F1 microcontroller. The design uses a standard ARM 10-pins cortex debug connector. The connector is shipped with the Crazyflie control board, but it is not soldered. So before doing any advanced debugging with the Crazyflie the user will have to solder the debug connector (it is always possible to flash new firmware using the radio bootloader).
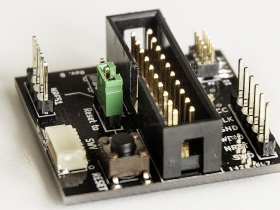
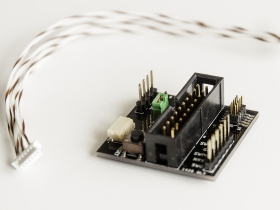
With Crazyflie 2.0 we wanted to make it easier to debug it out-of-the-box, without needing to solder. But the issue is that standard debug-connectors tend to be fairly large, so to fit the connector on the board we used a different connector that connects to an adapter board.
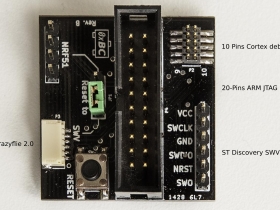
Aside from having a reset button, the adapter board will have 3 JTAG/SWD connectors:
- 20-Pins HE10 ARM JTAG with 2.54mm spacing: The most commonly used connector
- 10-Pins ARM Cortex with 1.27mm spacing: Used in some modern ARM board, the same as the current Crazyflie
- 6-Pins SWV with 2.54mm spacing: Compatible with the connector present on ST Discovery boards
The smaller 6-pin connector connects to the Crazyflie 2.0 for flashing and debugging of its 2 MCUs: The STM32F405 and nRF51822. The connector for debugging the STM32F4 is mounted on the Crazyflie 2.0. For the nRF51 we are still working to get a solder-free solution using the same cable/connector on the debug-adapter. Why not just put two connectors, or one big with all the signals on the Crazyflie? There’s just no more space on the board. The connector looks very small, but when you bring the footprint into KiCad it’s like parking a minivan in your bedroom :-)
Since all the connectors are wired together the board can also be used in a number of other combinations, like using it as a 20-pin to 10-pin Cortex JTAG adapter or any other combination of its connectors.


Very nice, all inclusive debug board!
One option that you might want to consider as well is to base something on the Black Magic Probe: http://www.blacksphere.co.nz/main/blackmagic.
The Black Magic Probe supports debugging STM32 and nRF51822 MCUs (as well as others). The hardware is open source, and is not much more than an STM32 F1. The firmware is also open source, and looks to be very portable.
The firmware presents a gdb extended interface over USB serial, so all you need to debug with it is gdb (no openocd, etc). It automatically detects the connected MCU, so it’s much easier to use than openocd/gdb combination.
I’ve considered (in other dual MCU designs that I’ve been considering) porting the BMP firmware to run as a module on the main MCU for debugging the secondary MCU. The secondary MCU (the nRF51822 in this case) would just need to have the SWD lines connected to GPIOs on the main MCU.
Just a thought to consider.
Hi Brian,
This sounds interesting, thanks for the tip! For this version of the adapter-board we won’t be able to do it, but we will keep it in mind for future versions. One down-side to this would be that the user cannot select their own probe/software combination though.
We have had some thoughts along the lines of the two MCUs being able to debug each other. We still haven’t gone into detail in any post about this, but the SWD is connected in both directions between the MCUs on the Crazyflie 2.0.
Black Magic Probe works witk Keil ?
Probably not, as far as I know Keil does not have support for gdb extended interfaces.
But the debug-adapter board will work with Keil, since you can use any JTAG/SWD debugger you like.
Do you have a ‘pcb of the month’ or ‘developer preview program’?
:)
Unfortunately not. We would like to have something like that, but currently we just don’t have enough time to arrange it. We will probably send out prototypes to a few selected developers, but that’s all we can do right now.
What is this debug adaptor board used for mainly?
It is mainly used to flash and debug the Crazyflie: You can flash Crazyflie with the radio bootloader but to be able to debug it (ex. add breakpoints in the code and inspect variables) you need a JTAG debugger.