We recently added improved support for assert information in the client and wanted to take this opportunity to describe some of the features in the console tab of the client that are useful for debugging and profiling.
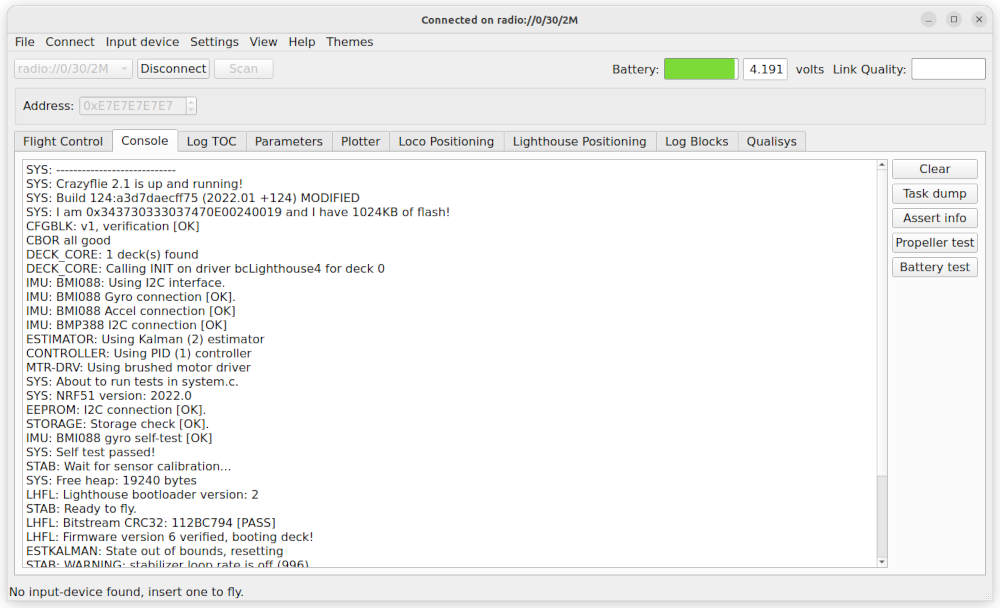
The console tab in the python client is where you can get real time logs from the Crazyflie when connected. Any DEBUG_PRINT() statements in the Crazyflie firmware will popup here and is obviously a simple way of adding debug information to your firmware. The console logs are buffered in the Crazyflie and dumped to the client when you connect, this is why you will see the start up information when connecting to a Crazyflie. If too much information is logged and the buffer is full, you will unfortunately loose some of it but you will be notified by a “<F>” marker in the console window.
On the right side of the console tab window you will find some useful buttons, the first being the “Clear” button that simply clears the console window.
Task dump
The “Task dump” button will print a list with information about the FreeRTOS tasks running in the system, for instance something like this.
SYSLOAD: Task dump
SYSLOAD: Load	Stack left	Name
SYSLOAD: 0.19 	205 		Tmr Svc
SYSLOAD: 83.70 	127 		IDLE
SYSLOAD: 0.01 	213 		CRTP-RX
SYSLOAD: 0.0 	54 		PWRMGNT
SYSLOAD: 0.70 	131 		LH
SYSLOAD: 0.0 	117 		CRTP-SRV
...Code language: CSS (css)
The “load” column contains how much of the total time that was spent in each task, since the previous measurement (or boot). To get useful values when performing some task, you probably want to make a dump at the start of your measurement and a second one at the end to get the average during this specific time.
The “Stack left” shows how many bytes of stack that is left for each task, this is the worst recorded number in the period. Stack size is recorded at task switch time which means it is possible that more stack actually was used at some point, but it should give a good indication if a task is running out of stack.
Assert info
Next up is the new “Assert info” button, it will dump assert or crash info to the console. When the STM CPU encounters a hard fault or some other condition that resets the CPU, it will record some basic crash information in a specific part of the RAM. This special RAM is not reset when the STM re-boots and it will automatically be dumped to the console log for investigation during the start up sequence. The “Assert info” button simply dumps the same information again, which may not sound very useful. But in some cases a client may auto-reconnect to a crashed Crazyflie, consume the console log and dispose of it before a human had the opportunity to look at it. In this case you can simply connect the client to the Crazyflie and click the “Assert info” button to get the information again.
Propeller test
The “Propeller test” button runs a automated test of the propellers and measures vibrations in the platform to determine if they are well balanced or not. The result is printed in the console window, like this: (looks like it is time to change one of my propellers!)
HEALTH: Acc noise floor variance X+Y:0.004469, (Z:0.002136)
HEALTH: Motor M1 variance X+Y: 4.17 (Z:0.55), voltage sag:0.35
HEALTH: Motor M2 variance X+Y: 0.22 (Z:0.42), voltage sag:0.37
HEALTH: Motor M3 variance X+Y: 1.23 (Z:0.21), voltage sag:0.35
HEALTH: Motor M4 variance X+Y: 1.09 (Z:0.17), voltage sag:0.31
HEALTH: Propeller test on M1 [FAIL]. low: 0.0, high: 2.50, measured: 4.17
ESTKALMAN: WARNING: Kalman prediction rate low (82)Code language: CSS (css)
Battery test
The final button is the “Battery test”. It tests if the battery is worn out by spinning the motors and measuring the drop in voltage. A drop in the voltage indicates that the battery probably is bad, but it can also be caused by other sources of extra resistance in the power path, for instance oxide on the battery connector. Use it as an indication only!
Note: Only use this test for the Crazyflie 2.x, not the Bolt or BigQuad.
The result of this test is printed in the console log:
HEALTH: Idle:4.15V sag: 0.67V (< 0.95V) [OK]Code language: CSS (css)The console side-by-side other tabs
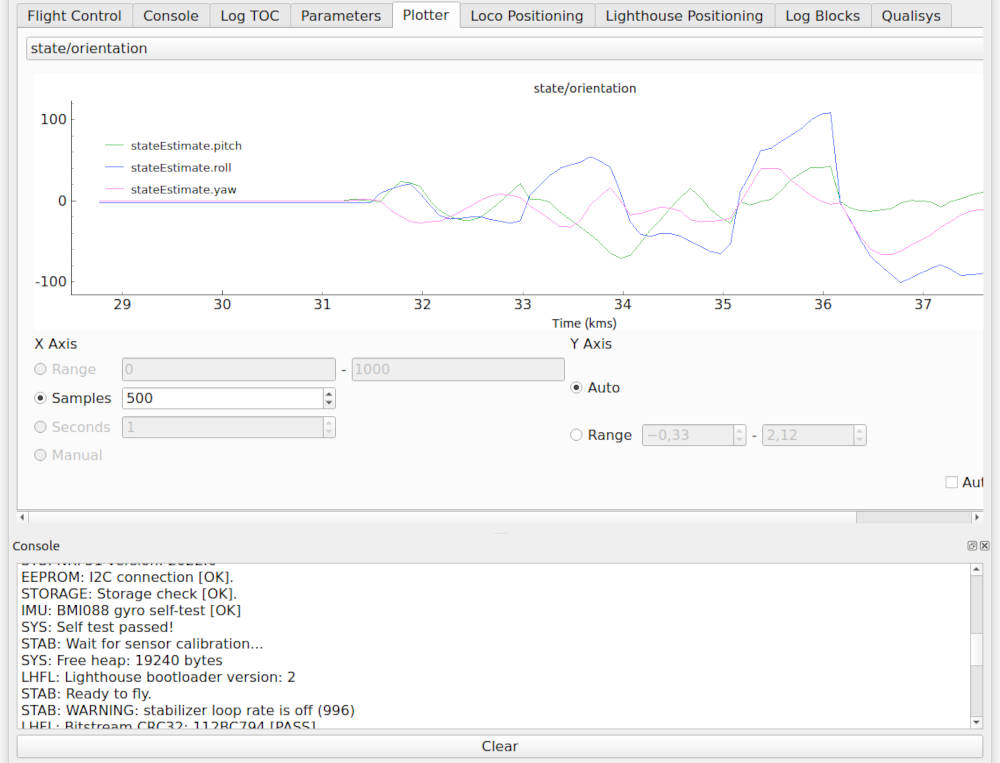
It is possible to add the console log as a tool box at the bottom or one of the sides of the client. In the “View” menu, choose “toolboxes” and click “Console”. A toolbox window with the console log will appear at the bottom of the screen which can be handy as it will be visible even if you switch to another tab.
Other debug tools
This post has been focused on the console tab, but there are of course other functionality that is useful when debugging your system. We will end by quickly mention some of them:
- The log and param framework with the Plotter tab and parameter tab in the client
- Wireshark
- Hardware debuggers