As you have noticed, we talk about the lighthouse positioning a lot these last couple of months ever since we got it out of early release. However, it is good to realize that it is not the only option out there for positioning your Crazyflie! That is why in this blog-post we will lay out possible options and explain how they are different/similar to one another.
Absolute Positioning / Off-board Pose Estimation
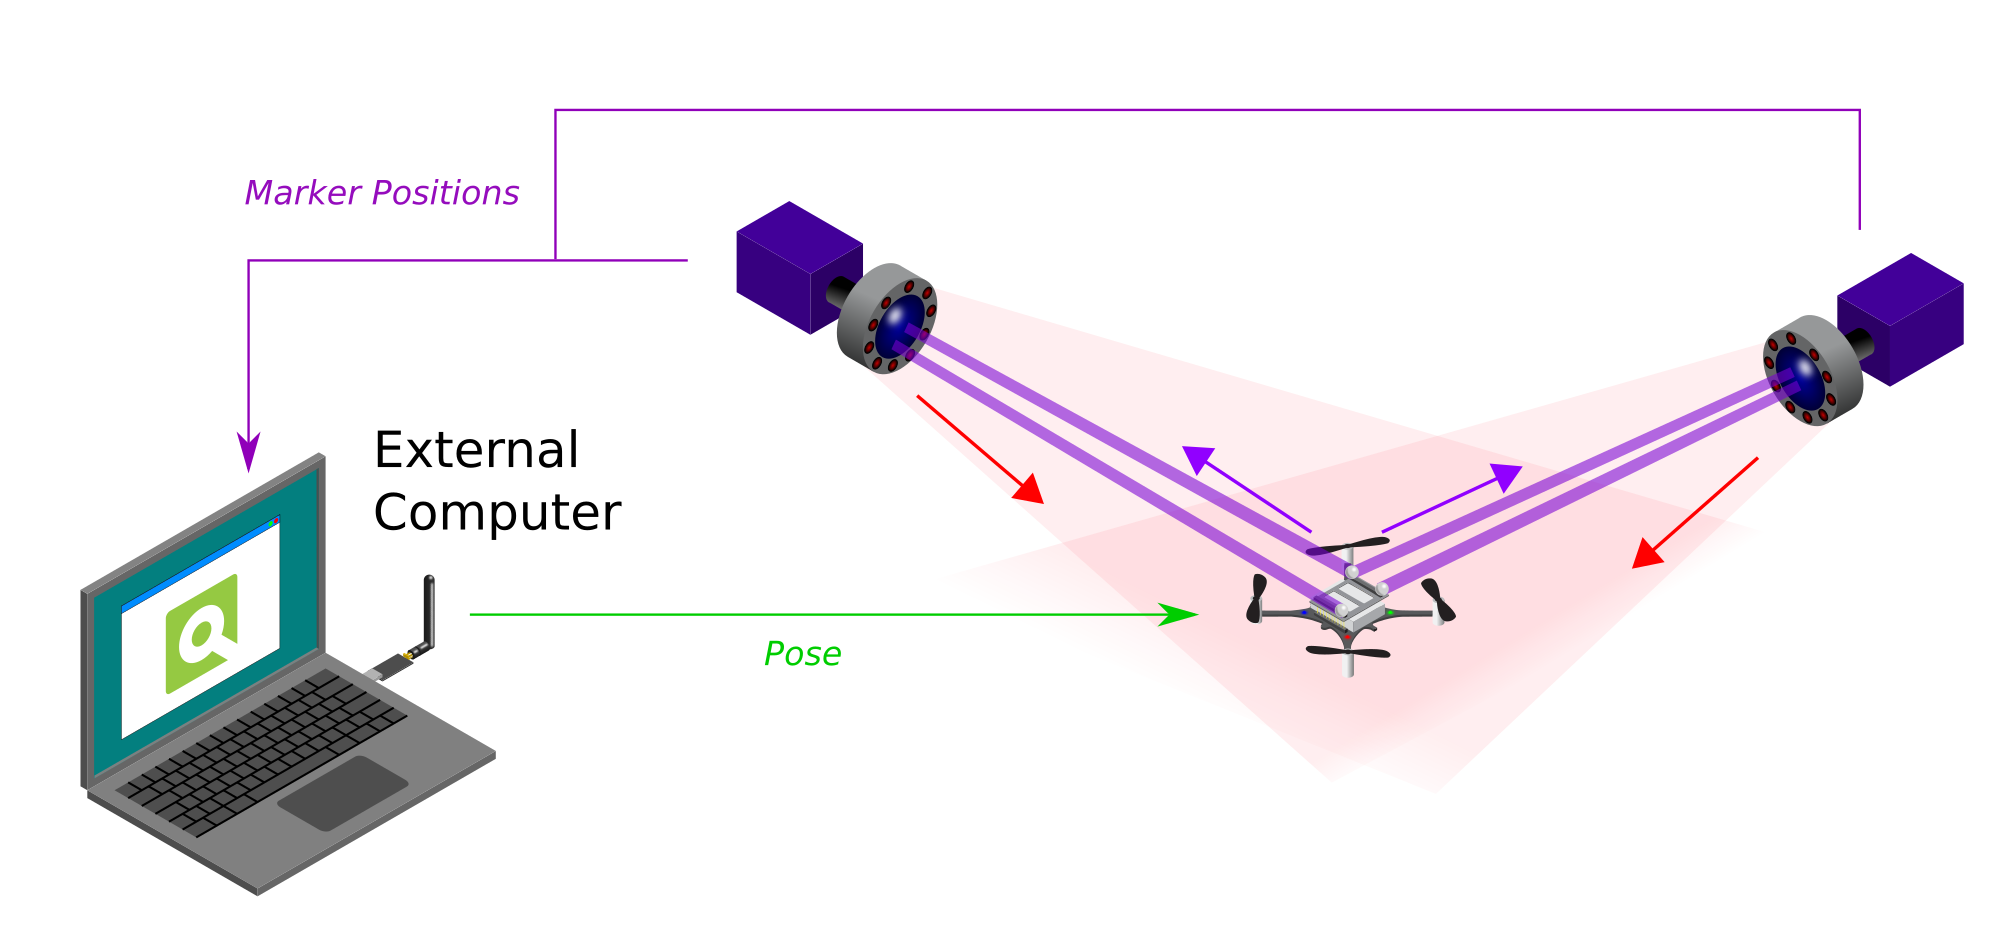
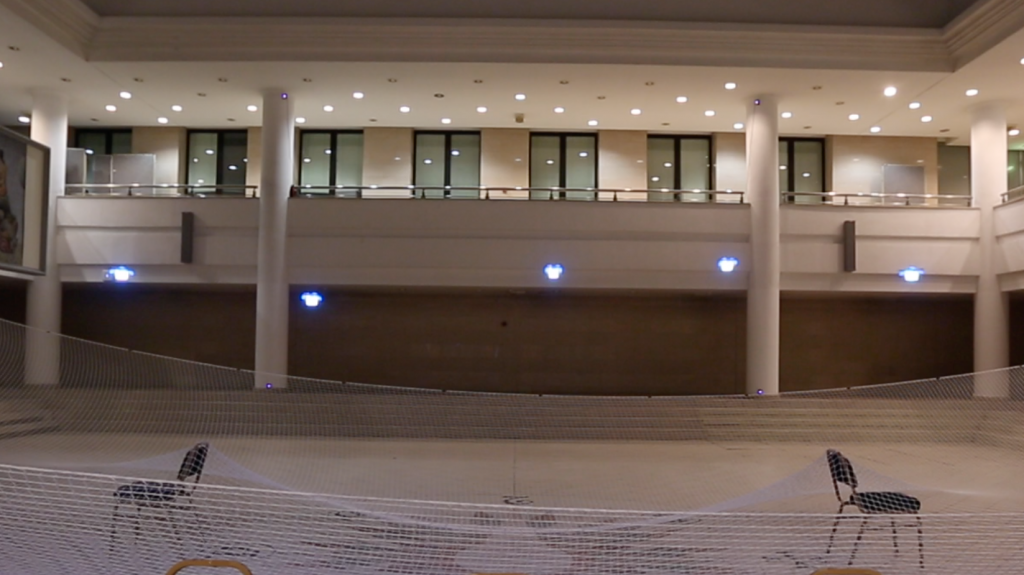
The first we will handle are the use of motion capture systems (MoCap), which resolves around the use of InfraRed cameras and Markers. We use the Qualysis camera ourselves but there are also labs out there that use Vicon or Optitrack. The general idea is that the cameras have an IR-light-emitting LED ring, which are bounced back by reflective markers that are supposed to be on the Crazyflie. These markers can therefore be detected by the same cameras, which pass through the marker positions to an external computer. This computer will have a MoCap program running which will turn these detected markers into a Pose estimate, which will in turn be communicated to the Crazyflie by a Crazyradio PA.
Since that the positioning is estimated by an external computer instead of onboard of the crazyflie, a MoCap positioning system is categorized as an off-board pose estimation using an absolute positioning system. For more information, please check the Motion Capture positioning documentation.
Absolute Positioning / On-board Pose Estimation
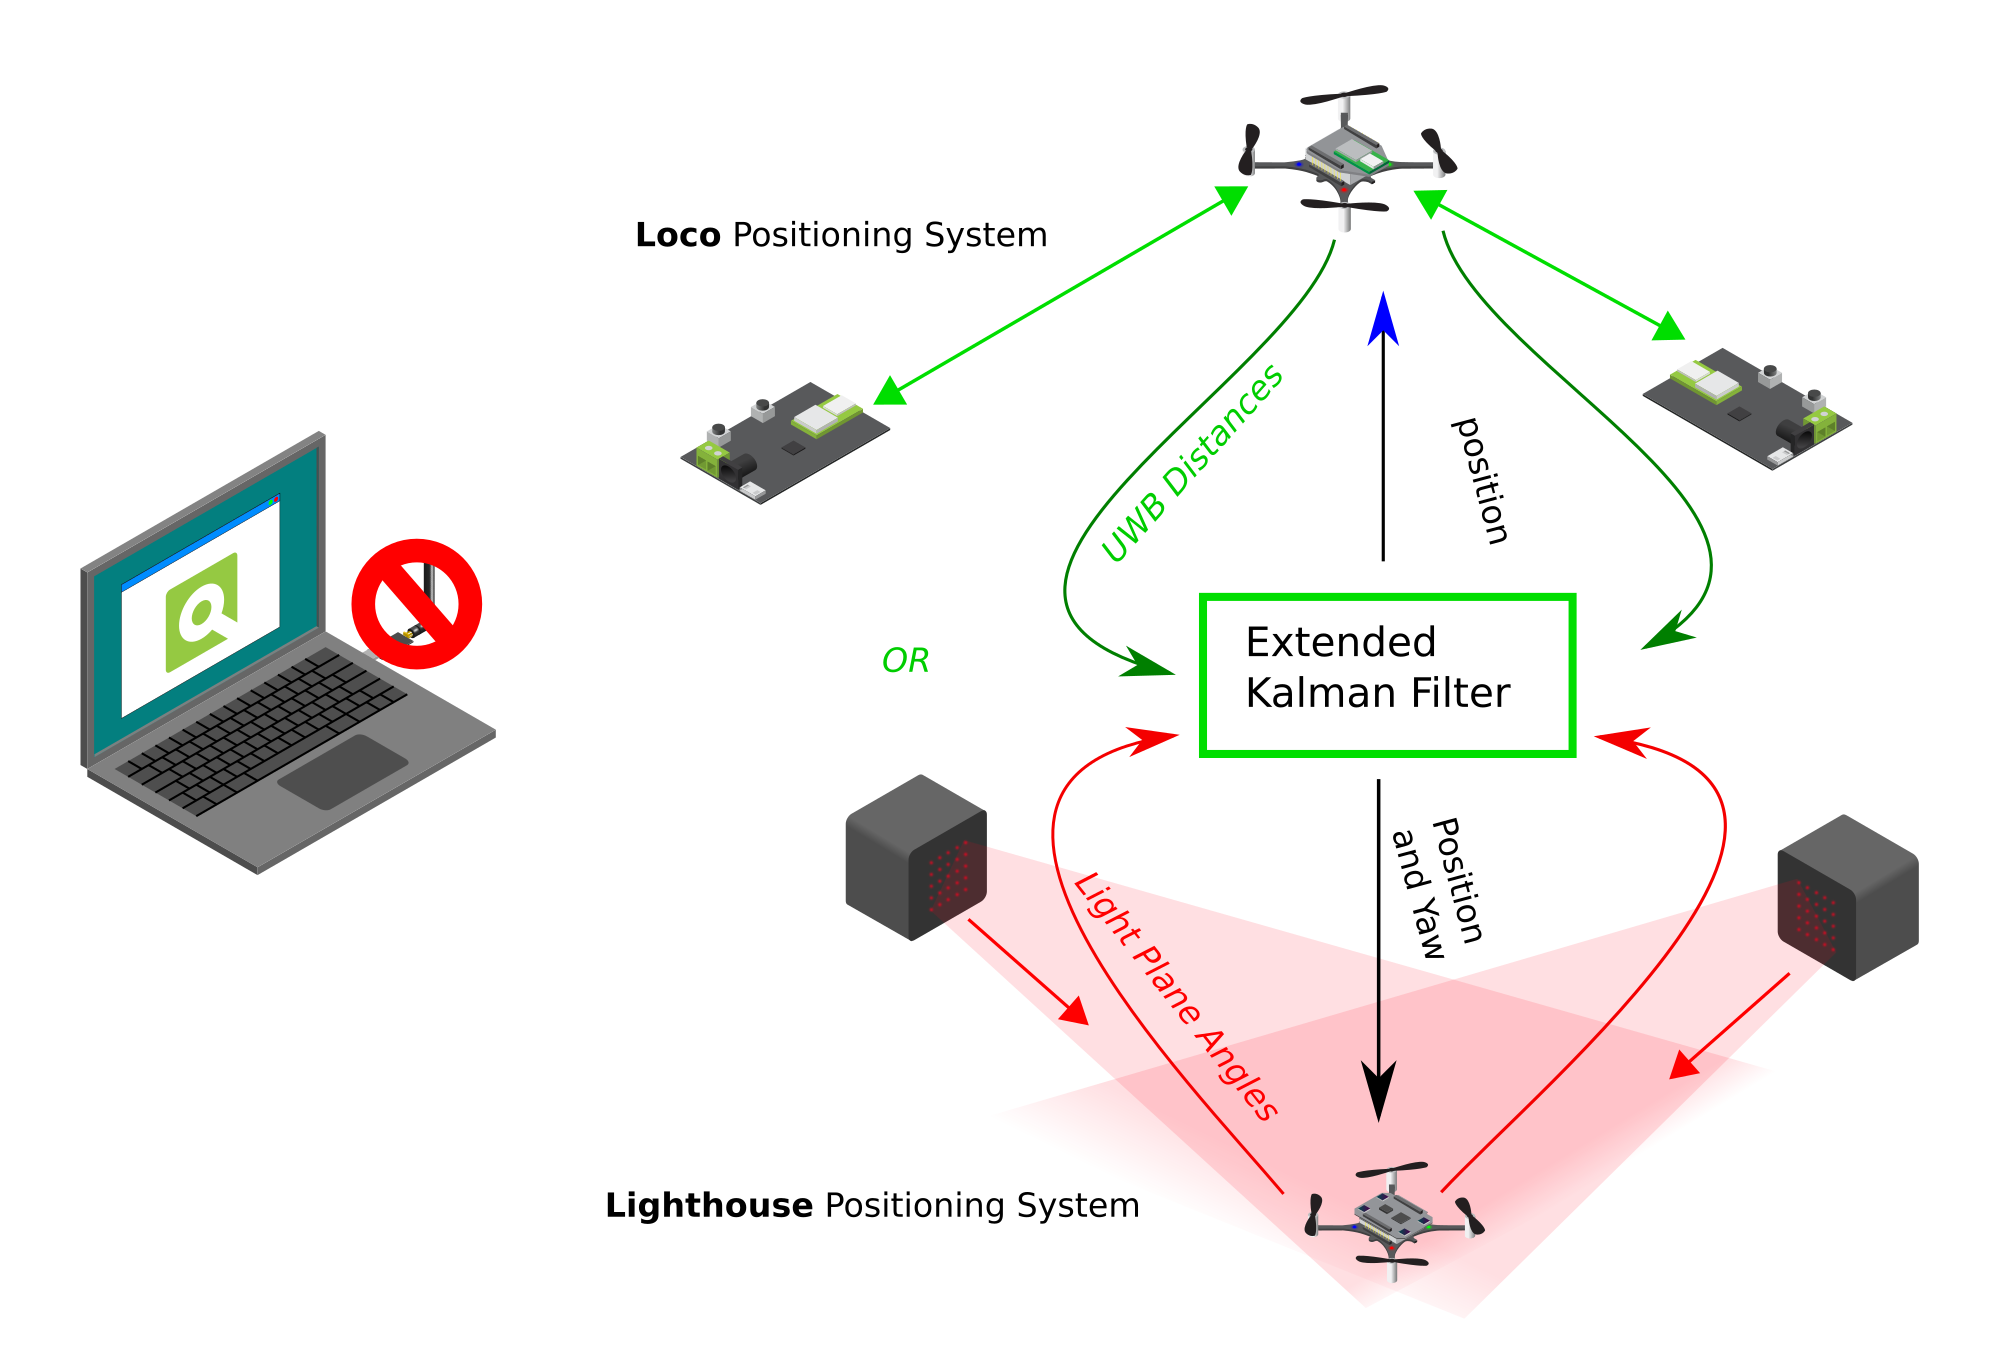
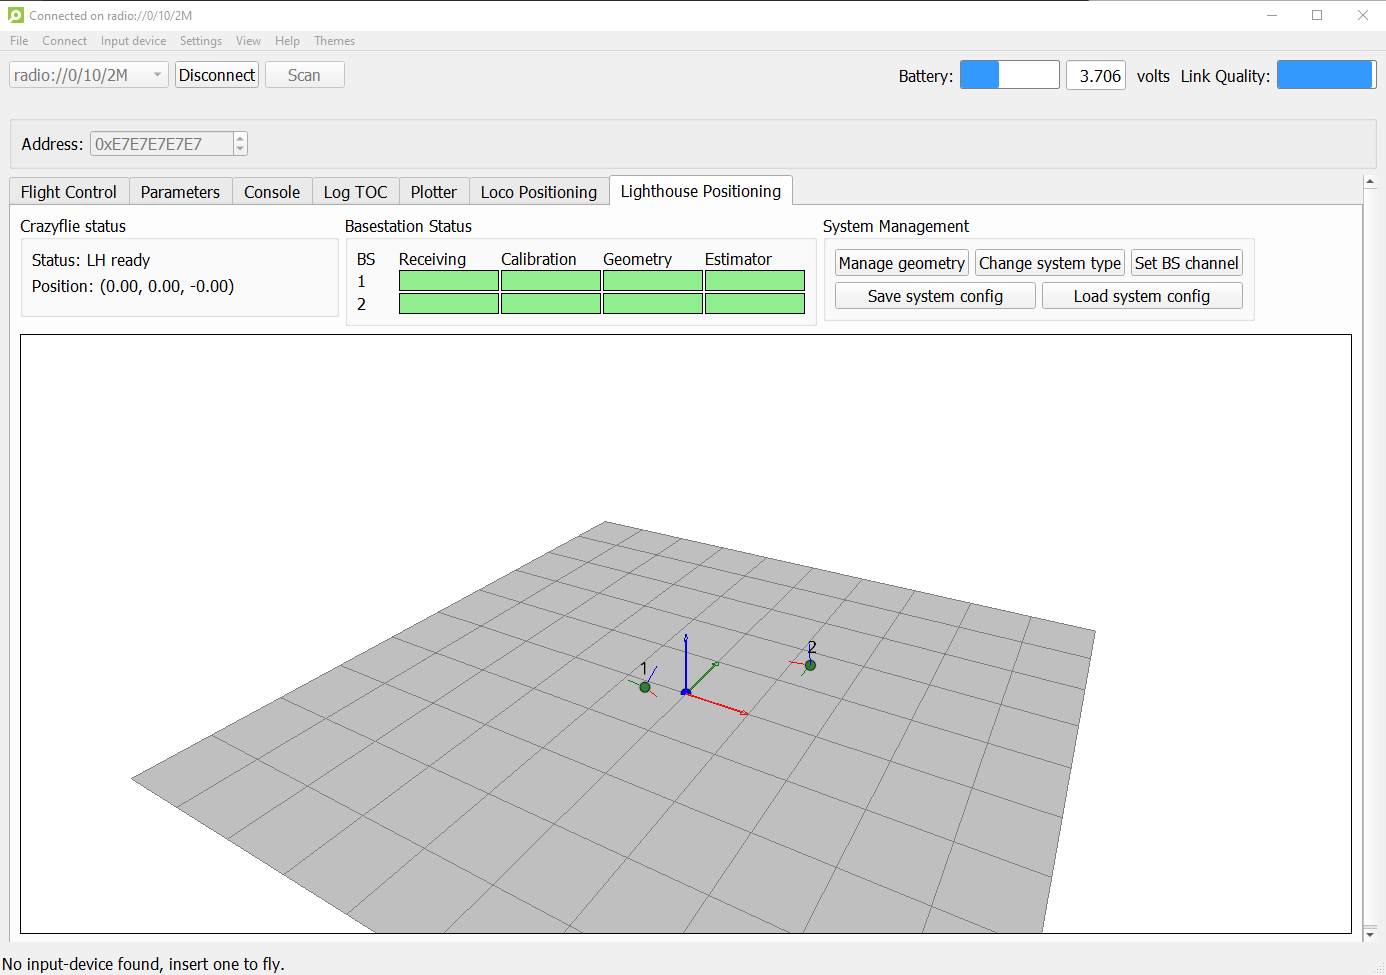
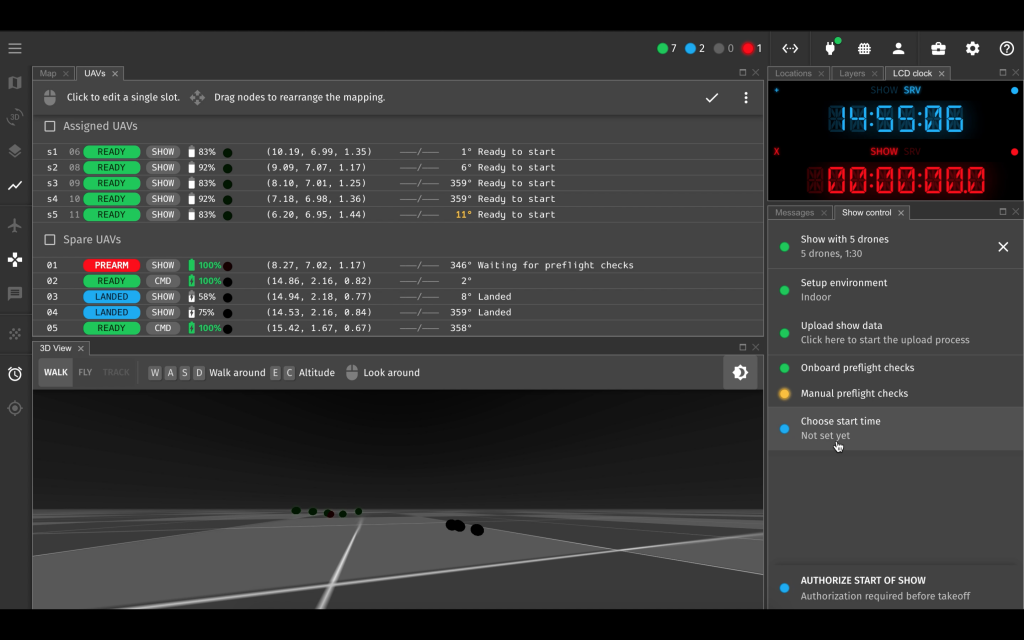
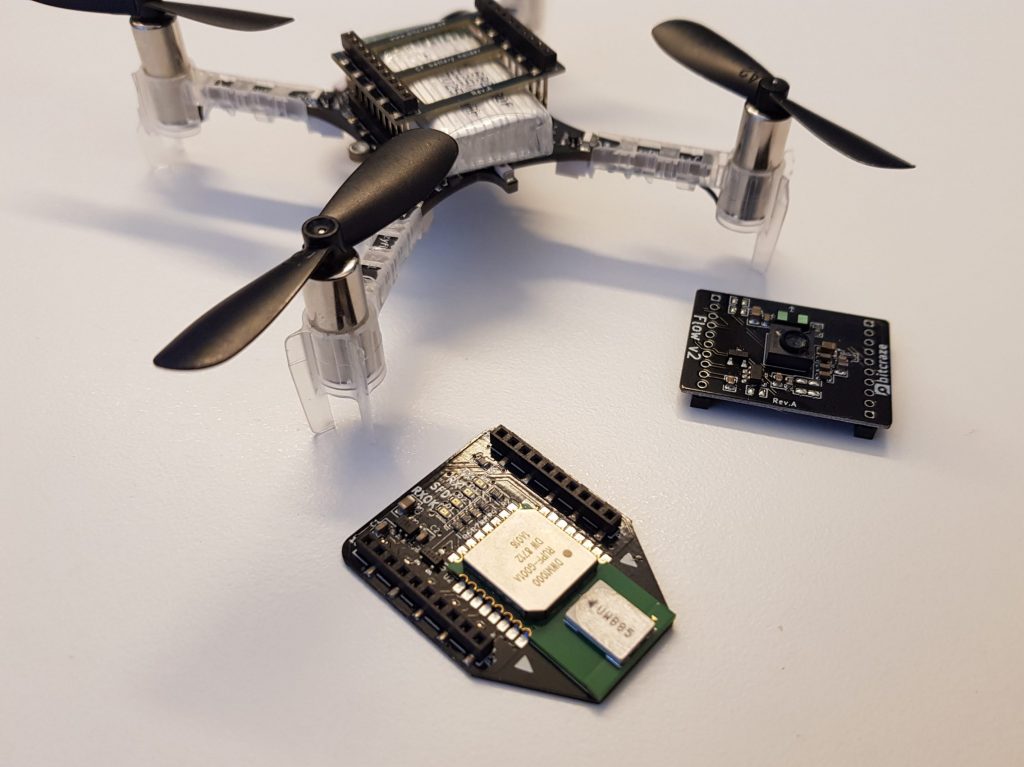
The next category is a bit different and it consists of both the Loco positioning system and the Lighthouse positioning system. Even though these both use beacons/sensors that are placed externally of the Crazyflie, the pose estimation is done all on-board in the firmware of the Crazyflie. So there is no computer that is necessary to communicate the position back to the Crazyflie. Remember that you do need to communicate the reference set-points or high level commands if you are not using the App layer.
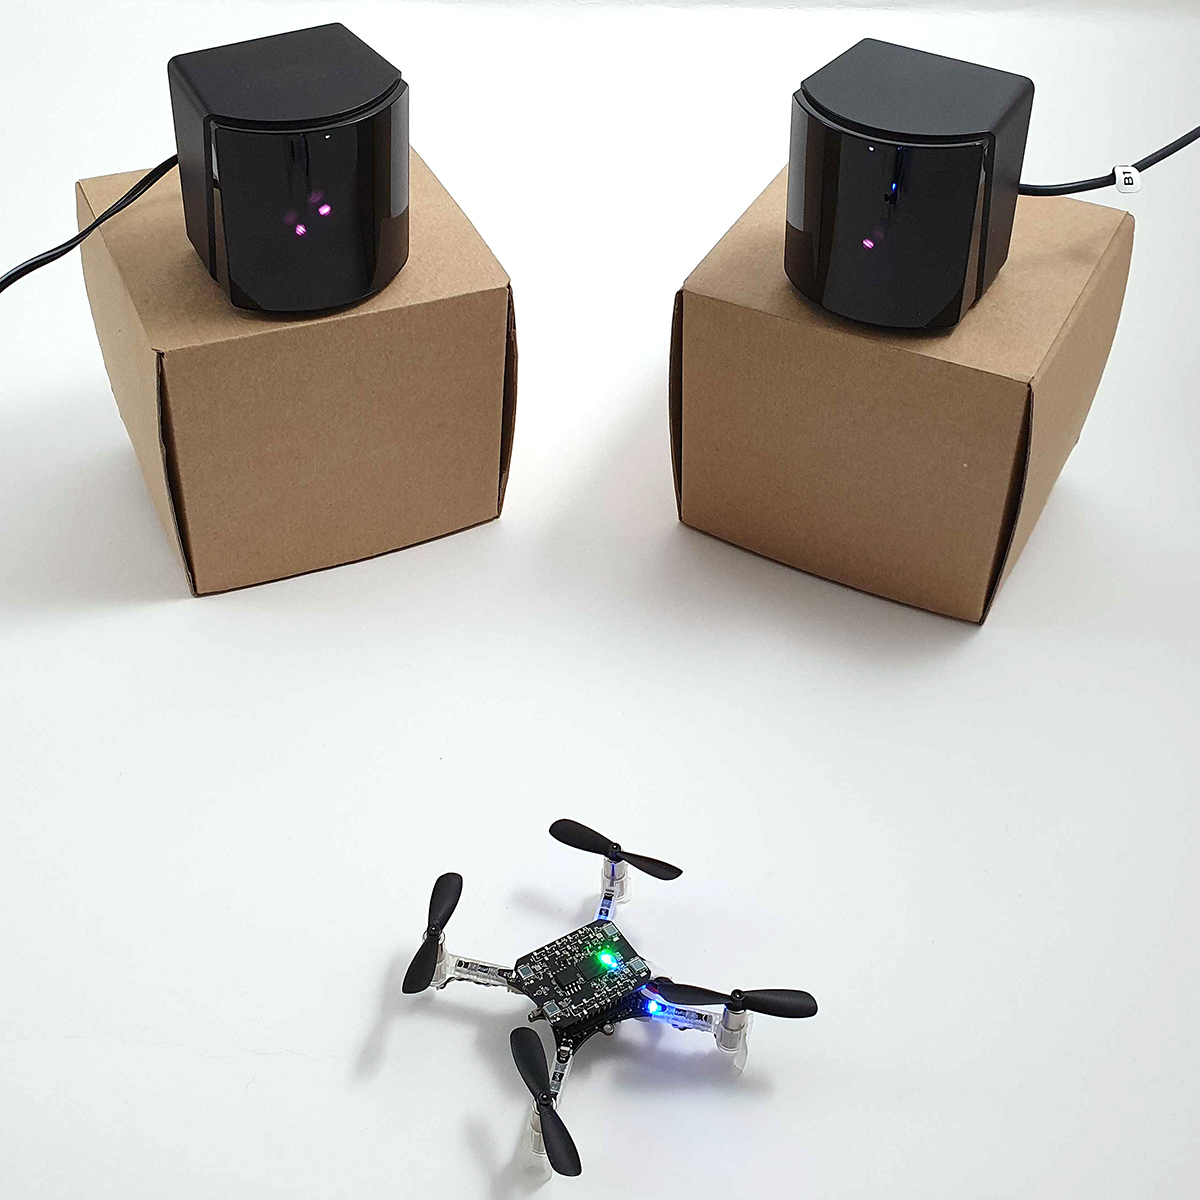
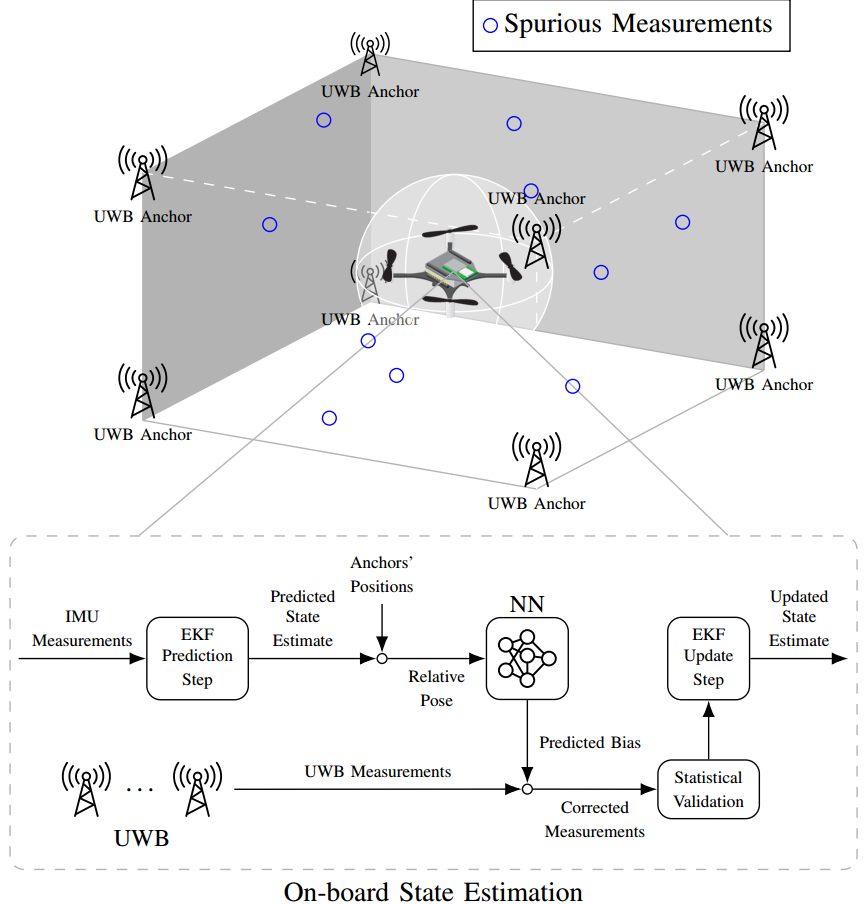
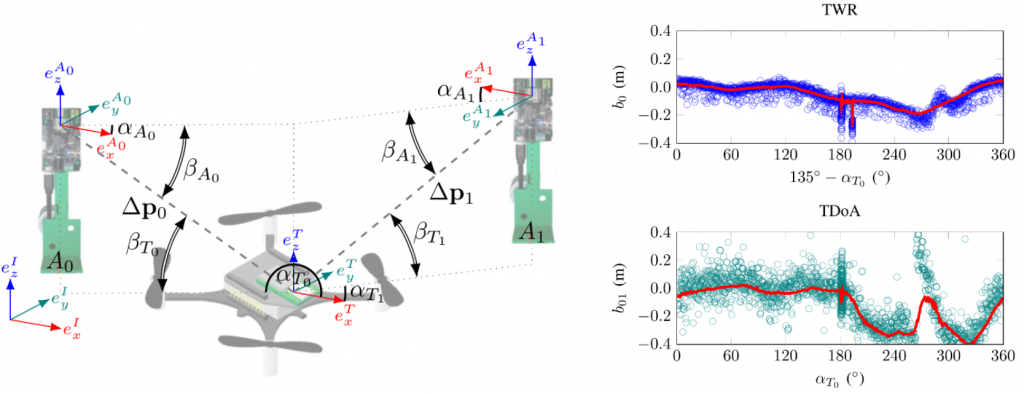
Of course there are clear differences in the measurement type. A Crazyflie with the Locodeck attached takes the distance to the externally placed nodes as measured by ultra wide band (UWB) and the Lighthouse deck detects the light plane angles emitted by the Lighthouse Base Stations. However the principle is the same that those raw measurements are used as input to the Extended Kalman filter onboard of the Crazyflie, and outputs the estimated pose after fusing with the IMU measurements.
Therefore these systems can be classified as absolute positioning systems with on-board pose estimation. To learn more please read the Loco and Lighthouse positioning system documentation!
Relative Positioning / On-board Pose Estimation
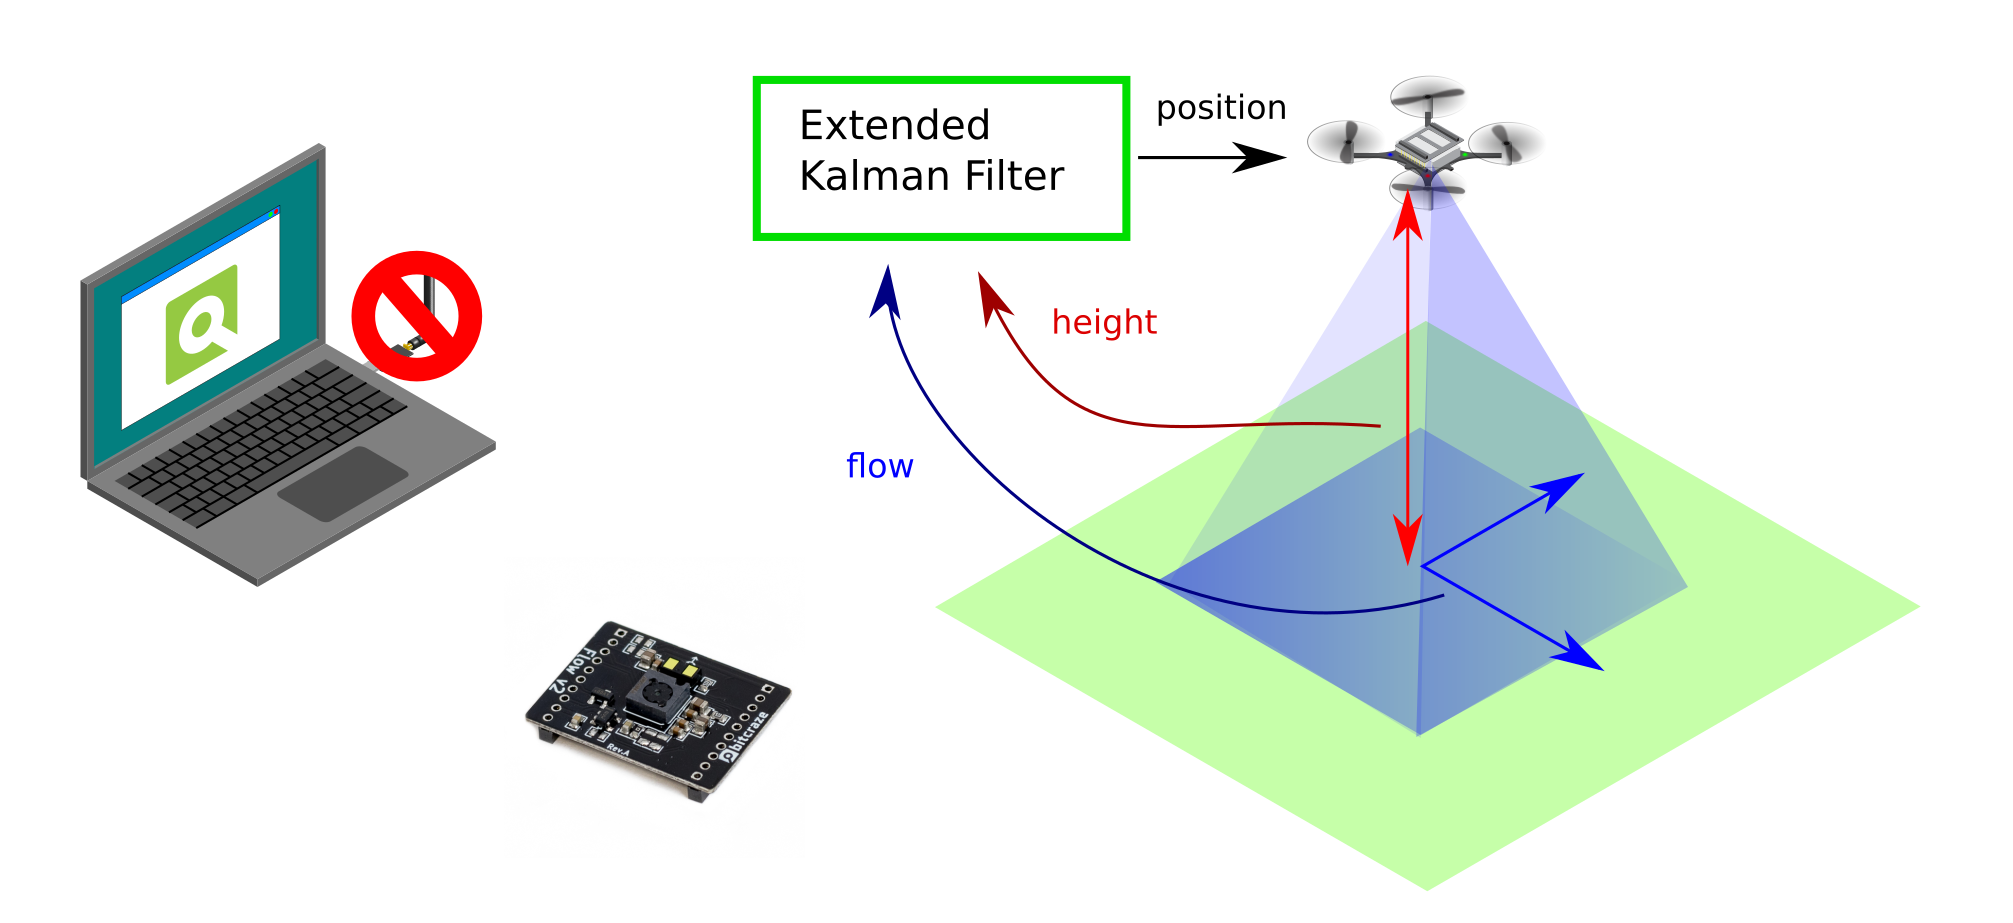
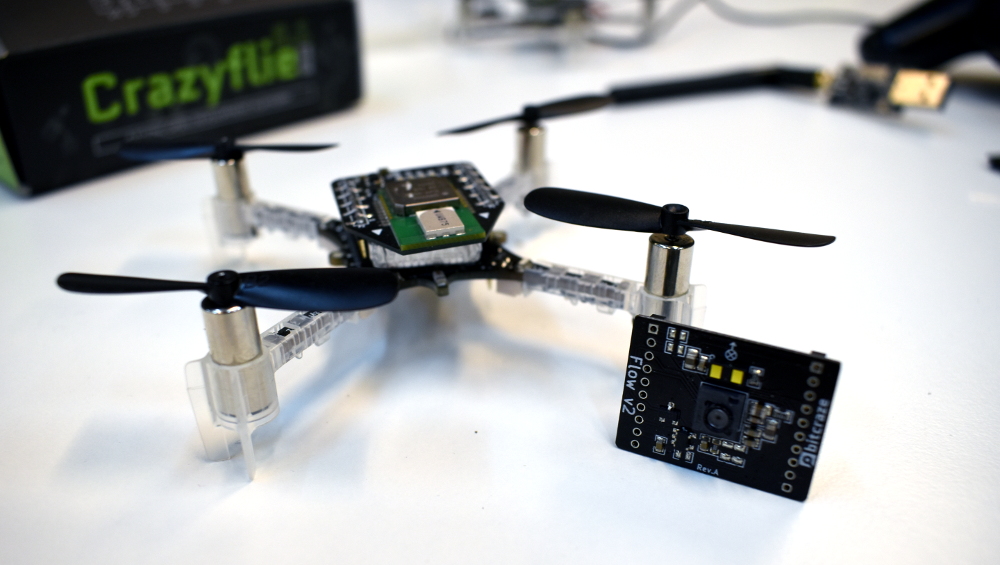
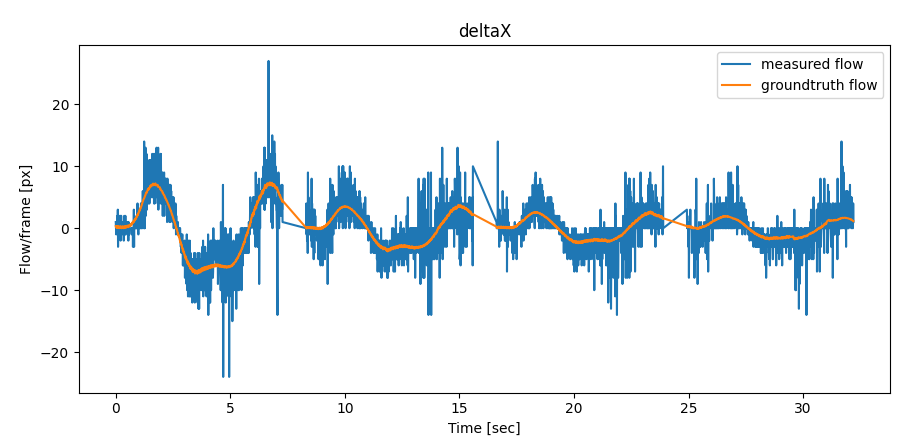
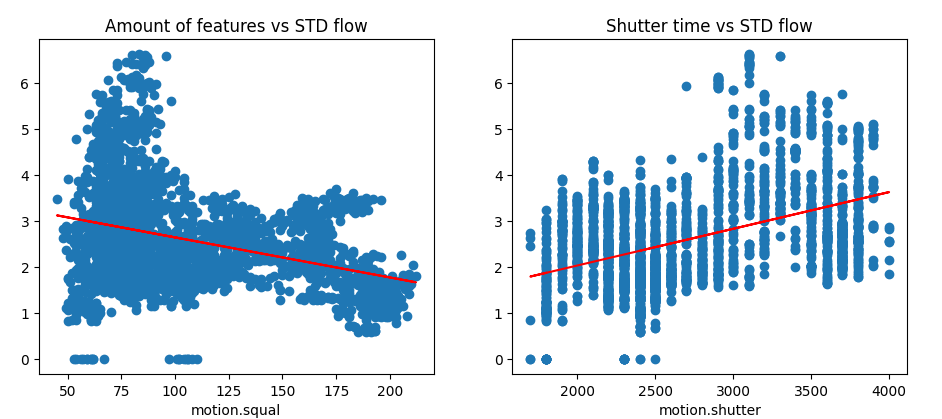
It is not necessary to have to setup an external positioning system in your room in order to achieve a form of positioning on the Crazyflie. With the Flowdeck attached, the Crazyflie can measure flows per frame with an optical flow sensor and the height in millimetres with a time of flight sensor. These measurements are then fused together with the IMU within the Extended Kalman filter (see the Flow deck measurement model), which results in a on-board pose estimation.
The most important difference here to note is that positioning estimated by only the Flowdeck, will not result in a absolute positioning estimate but a relative one. Instead of using an external placed system (like MoCap, Lighthouse and Loco) which dictate where the zero position is in XYZ, the start-up position the Crazyflie determines where the origin of the coordinate system is. That is why the Flowdeck is classified as a Relative Positioning System with On-board Pose Estimation.
IMU-only On-board Pose Estimation ?
Oh boy… that is a different story. Theoretically it could be possible by using the onboard accelerometers of the crazyflie and fusing those in some short of estimator, however practice has shown that the Crazyflie’s accelerometers are too noisy to result in any good pose estimation… We haven’t seen any work that has been successfully to achieve any stable hover on only the IMU of the Crazyflie, but if you have done/see research that has, please let us know!
And if you would like to give a go yourself and build an estimator that is able to do this, please check out the new out of tree build functionality for estimators. This is still work in progress so it might have some bugs, but it should enable you to plugin in your own estimator separate from the Crazyflie firmware ;)
Documentation
We try to keep keep all the information of all our positioning systems on our website. So check out the positioning system overview page to be referred to more details if you would be interested in a particular system that fits your requirements!